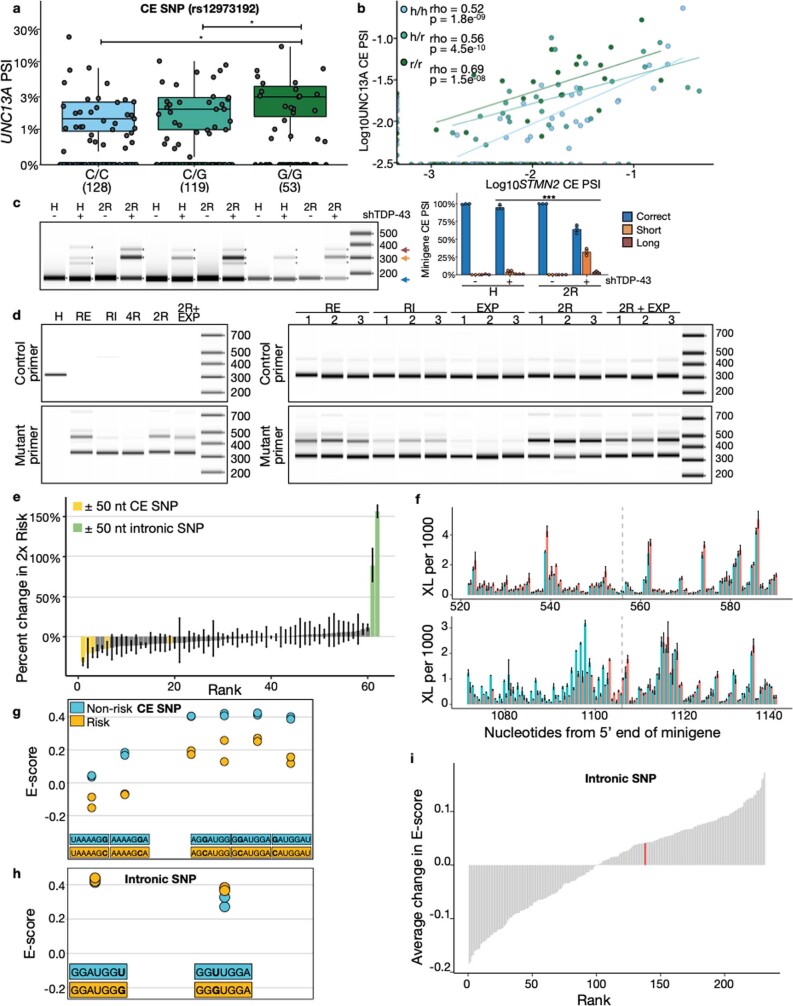
Extended Data Fig. 8. UNC13A risk alleles increase UNC13A CE expression after TDP-43 depletion by altering TDP-43 binding affinity across the UNC13A CE-containing intron.
(a) UNC13A CE PSI by genotype (Wilcoxon test) Box plots: boundaries 25-75th percentiles; midline, median; whiskers, Tukey style. (b) Effect of CE or intronic SNP on the correlation between STMN2 and UNC13A CE PSI in ALS/FTD cortex in samples with at least 30 junction reads across the CE locus. Spearman’s correlation. (c) Raw tapestation gel images of UNC13A CE products in 2H and 2R minigines and quantification of the PCR products. Graphs represent the means ± SEM(n = 3 biological replicates); Two-way ANOVA (d) Raw tapestation gel images corresponding to Fig. 4e. Two sets of primers were used to amplify either control (top row) or mutant minigene (bottom row). Left panel: single transfections were performed to ensure primer specificity. Right panel: three biological replicates of the double transfections. (e) Fractional changes at iCLIP peaks for 2R versus 2H minigene (mean and 75% confidence interval shown). Peaks that are within 50nt of each SNP are highlighted. (f) Mean crosslink density around the exonic (top) and intronic (bottom) SNPs in the 2H (red) and 2R (blue) minigenes, relative to the 5’ end of minigene (error bars = standard deviation; dashed lines show SNP positions). (g, h) Individual TDP-43 E-scores for the CE (g) and intronic (h) heptamers for which there was data27 (i) Average change in E-value (measure of binding enrichment) across proteins for heptamers containing risk/healthy intronic SNP allele; TDP-43 is indicated in red. Significance levels reported as * (p < 0.05) ** (p < 0.01) *** (p < 0.001) **** (p < 0.0001).

