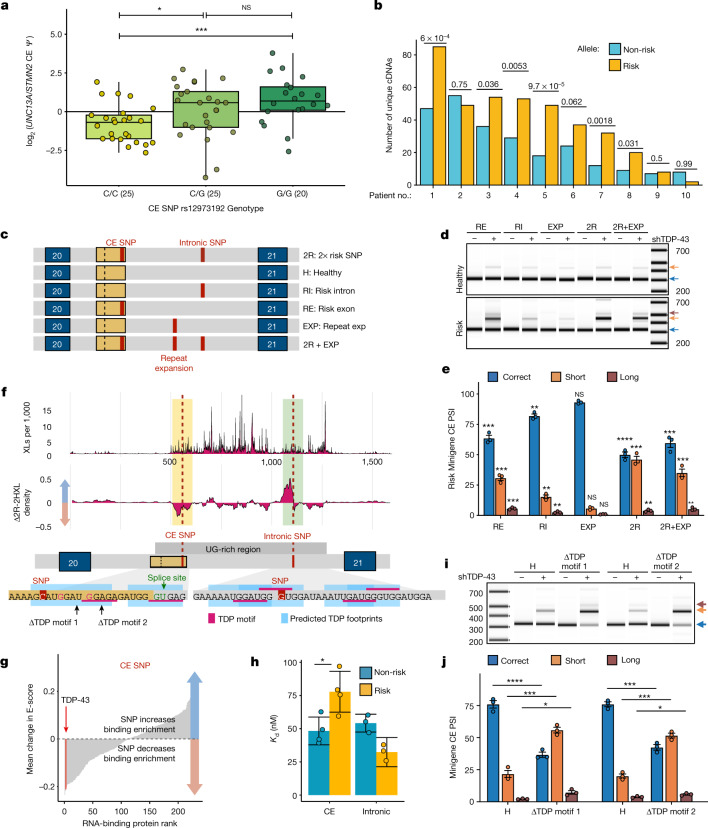
Fig. 4. UNC13A ALS and FTD risk variants enhance UNC13A CE splicing in patients and in vitro by altering TDP-43 pre-mRNA binding.
a, Ratio of UNC13A and STMN2 CE Ψ in ALS-TDP and FTLD-TDP cortex, split by genotype for UNC13A risk alleles. In box plots, the centre line shows the median, box edges delineate 25th and 75th percentiles and Tukey whiskers are plotted. b, Unique cDNAs from targeted RNA-seq in ten patients with FTLD-TDP who are heterozygous for the risk SNP within the UNC13A cryptic exon. Single-tailed binomial tests. Patients 1, 5 and 7 carry the C9orf72 hexanucleotide repeat. c, Schematic of UNC13A minigenes containing exon 20, intron 20 and exon 21 and combinations of UNC13A alleles. d, e, Representative image (d) and quantification (e) of RT–PCR products from UNC13A minigenes in SH-SY5Y cells with or without TDP-43 knockdown. Data are mean ± s.e.m. Each variant was compared with the healthy minigene with which it was co-transfected and results were compared with an unpaired t-test (n = 3 biological replicates). f, TDP-43 iCLIP of SH-SY5Y cells containing 2R and 2H minigenes. Top, average crosslink density. Middle, average density change 2R for − 2H (20-nt rolling window, units are crosslinks per 1,000). Bottom, predicted TDP-43 binding footprints (UGNNUG motif). g, Average change in E-value (measure of binding enrichment) across proteins for heptamers containing risk or healthy CE SNP alleles. TDP-43 is indicated in red. h, Binding affinities between TDP-43 and 14-nt RNA containing the CE (n = 4) or intronic (n = 3) healthy or risk sequences measured by isothermal titration calorimetry. Data are mean ± s.d.; two-sample t-test. i, j, Representative image (i) and quantification (j) of RT–PCR products from UNC13A minigenes with mutated UGNNUG TDP-43 binding motifs as shown in f. Data are mean ± s.e.m.; n = 3 biological replicates; statistical analysis as in (d, e).

