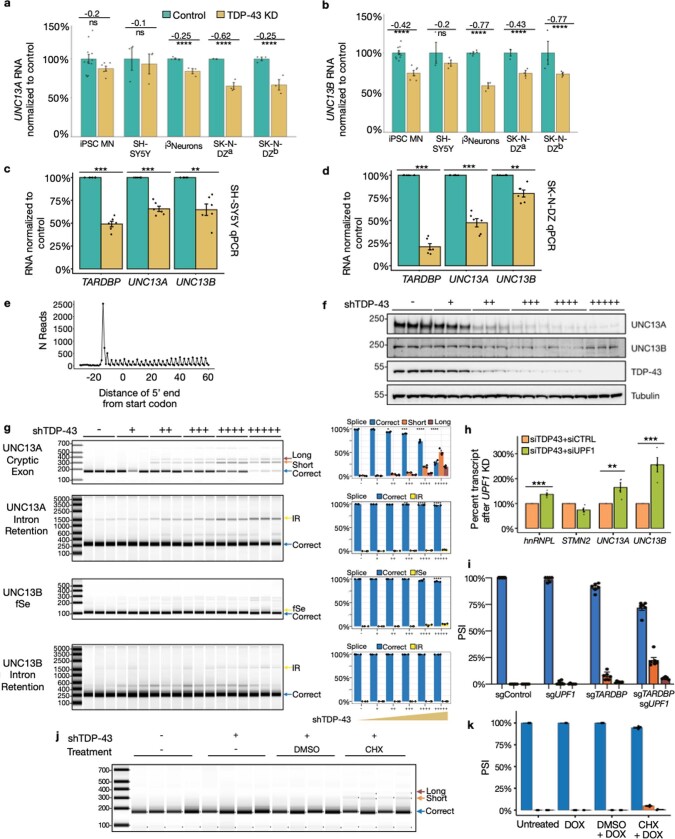
Extended Data Fig. 3. Reduction of UNC13A and UNC13B after TDP-43 knockdown correlates with TDP-43 levels and is caused by nonsense-mediated decay.
Relative gene expression levels for UNC13A (a) and UNC13B (b) after TDP-43 knockdown across neuronal cell lines9,21. Normalized RNA counts are shown as relative to control mean. Numbers show log fold change calculated by DESeq2. Significance shown as adjusted p-values from DESeq2. Number of replicates as in Extended data Fig. 1 H-L (c, d) RT-qPCR analysis shows TDP-43, UNC13A and UNC13B gene expression is reduced by TARDBP shRNA knockdown in both SH-SY5Y and SK-N-BE(2) human cell lines. Graphs represent the means ± SEM, n = 6 biological replicates, one sample t-test. (e) The 5’ ends of 29 nt reads relative to the annotated start codon from a representative ribosome profiling dataset (TDP-43 KD replicate B). As expected, we detected strong three-nucleotide periodicity, and a strong enrichment of reads across the annotated coding sequence relative to the upstream untranslated region. (f) UNC13A, UNC13B, and TDP-43 protein levels, measured by Western Blot, with varying levels of DOX-inducible TDP-43 knockdown in SH-SY5Y cells. Tubulin is used as endogenous control, n = 3. For gel source data, see Supplementary Figure 1. (g) Quantification of RT-PCR products from the transcripts containing UNC13A CE, UNC13A intron retention, UNC13B fsE, and UNC13B intron retention, with varying levels of DOX-inducible TDP-43 knockdown in SH-SY5Y cells. Graphs represent the means ± SEM n = 3 biological replicates. (h) UPF1 siRNA knock-down led to the rescue of hnRNPL (positive control), UNC13A, and UNC13B transcripts, but not STMN2. Graphs represent the means ± SEM, n = 4 biological replicates, one-sample t-test. (l) UNC13A CE containing-transcript PSI is increased after UPF1 knockdown in i3Neurons. Graphs represent the means ± SEM, n = 6 biological replicates. (j) RT-PCR products from UNC13A in the setting of mild TDP-43 knockdown (“+”, as for Figure 2C and S4G) with the addition of either DMSO (control) or CHX (NMD inhibition). (k) Quantification of (j) Graphs represent the means ± SEM, n = 4 biological replicates. Significance levels reported as * (p < 0.05) ** (p < 0.01) *** (p < 0.001) **** (p < 0.0001).

