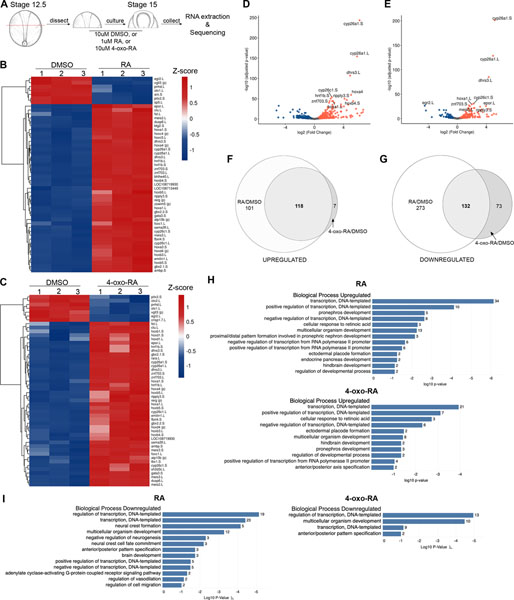
Figure 6: RNA-Seq analysis reveals similarities in genes regulated by RA and 4-oxo-RA.
(A) Schematic of experimental design for RNA-Seq analysis. (B) Heatmap analysis showing the top 50 differentially expressed genes based on pairwise comparison of normalized count matrix between 10μM DMSO and 1μM RA treated anterior embryo halves. (C) Heatmap analysis of the top 50 differentially expressed genes between 10μM DMSO and 10μM 4-oxo-RA treated anterior embryo halves, similarly analyzed as (B). Heatmaps were colored by z-score. (D) Volcano plots showing significance of differential gene expression on y-axis (log10 adjusted p-value) vs. magnitude of differential gene expression on x-axis (log2 fold change) for 10μM DMSO versus 1μM RA treated anterior halves, with the top 10 genes labeled with their Xenbase ID. (E) Volcano plot similarly analyzed as (D) showing top 10 differentially regulated genes for 10μM DMSO versus 10μM 4-oxo-RA treated anterior halves, with top 10 genes with their Xenbase ID. Venn Diagram analysis for genes upregulated (F) or downregulated (G) upon RA and 4-oxoRA treatments. GO analysis using DAVID Bioinformatics Resources was performed for genes upregulated by RA (H, top) and 4-oxo-RA (H, bottom). GO analysis for genes downregulated by RA (I, left) and 4-oxo-RA (I, right).

