
Figure 5. Changes in Th17s and Tregs with dFCR Treatment as shown with Mass Cytometry.
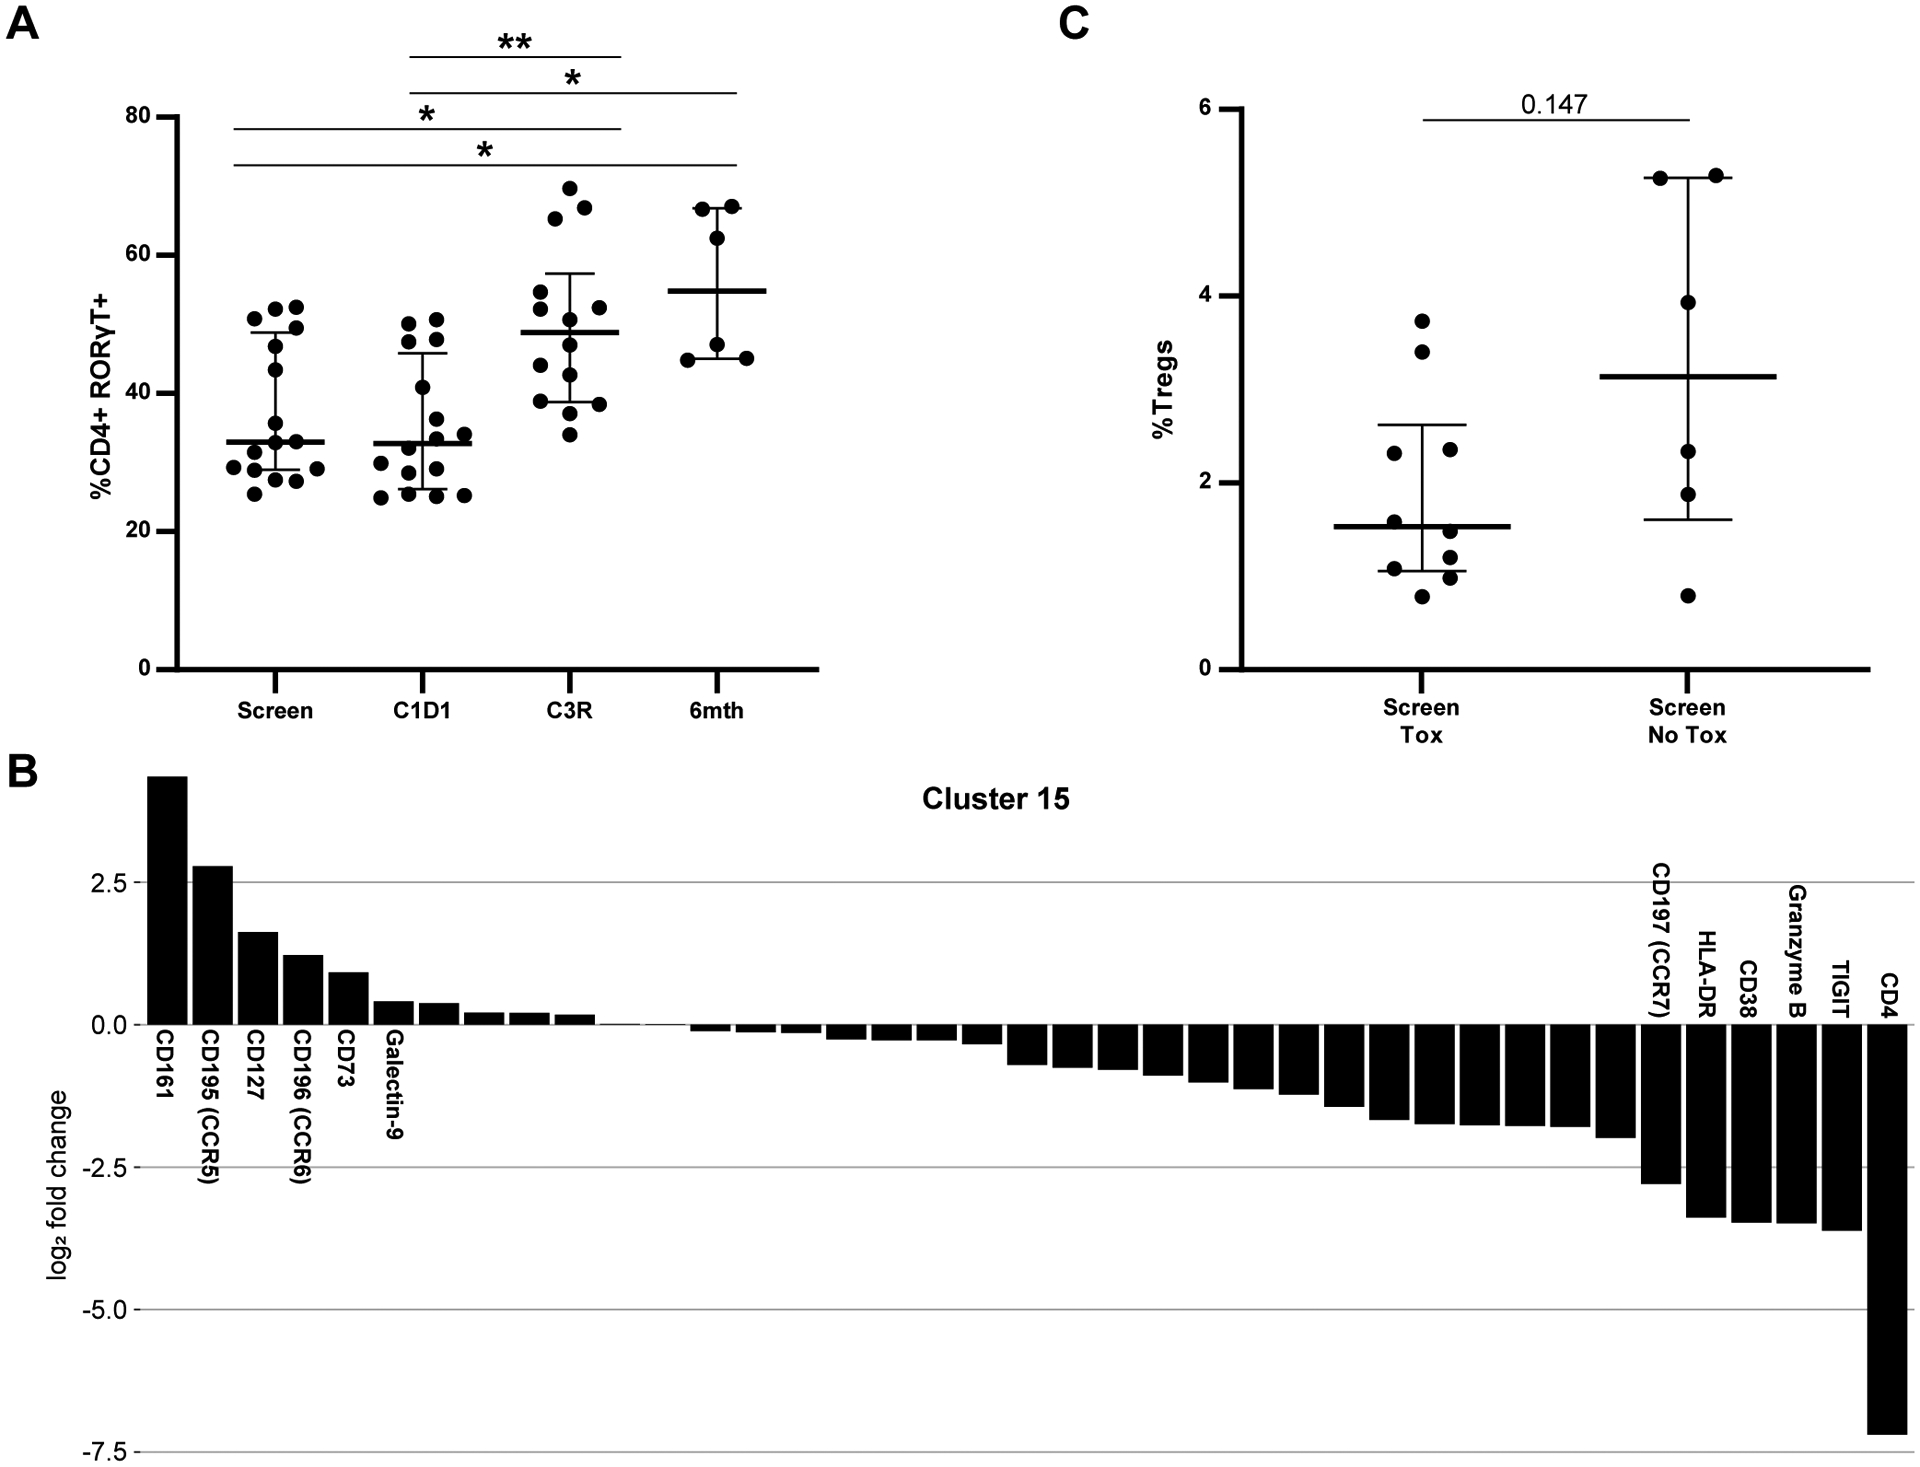
A. Change in CD4+ RORγT+ cells over time in the entire population. B. Markers driving clustering for c15, a Th17 phenotype CD8. C. %Tregs at screen comparing patients with and without toxicity. * p≤ to 0.05; ** p≤ to 0.01.