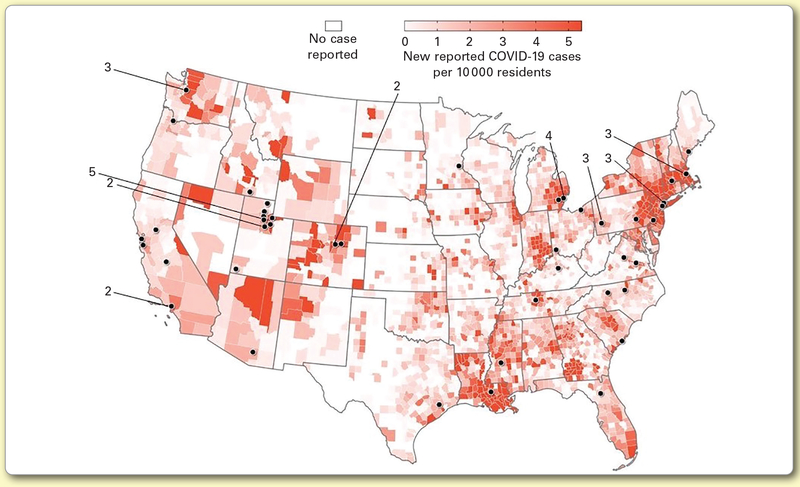
Figure 1.
Map of contributing hospitals with associated county-level COVID-19 incidence during cohort eligibility. Choropleth map illustrates spatial variation in county-level COVID-19 incidence rate (cases per 10 000 residents) during the third week of March 2020 (see Supplement 1). Dots represent contributing hospitals. For closely adjacent hospitals, a single dot indicates the location of multiple hospitals and is labeled with the number of contributing sites represented.

