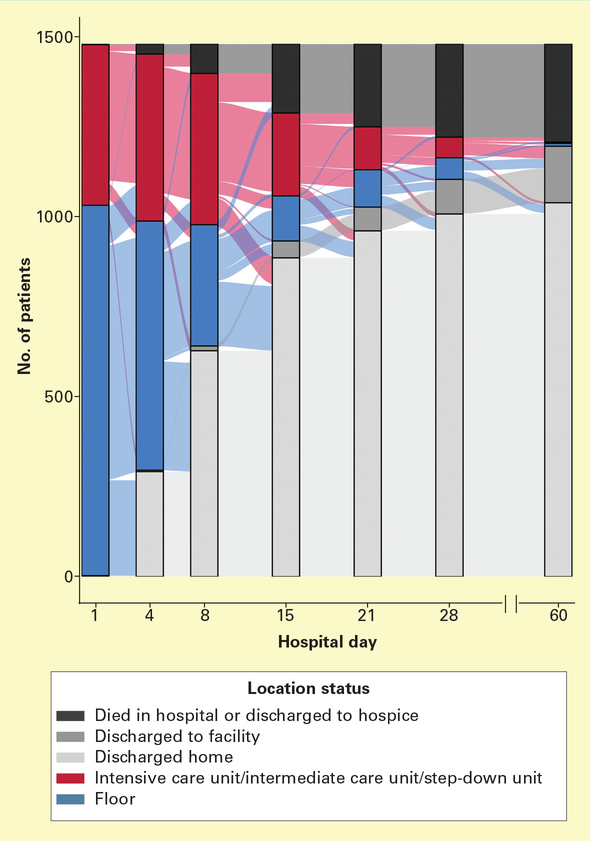
Figure 2.
Hospital level of care from arrival at study hospital through discharge or hospital day 60. Alluvial diagram depicts patients’ transitions between treatment intensity levels during their hospitalization and ends on study hospital discharge. Because patients were not followed up beyond hospital discharge, patients do not transition out of postdischarge status of home or facility.

