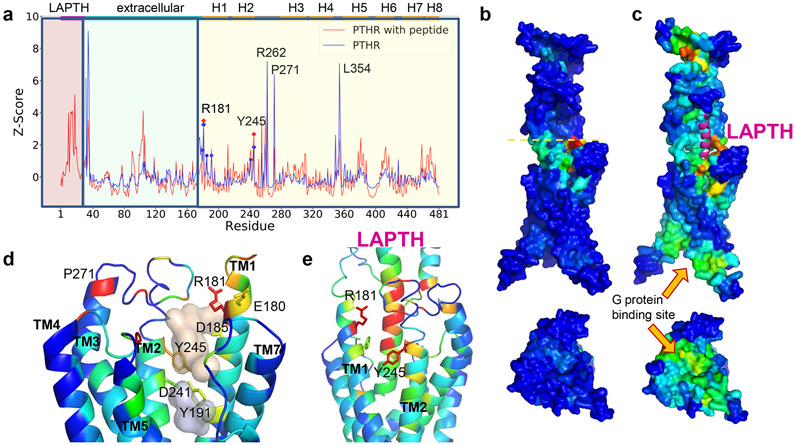
Figure 1. ESSA points to an extracellularly-exposed pocket as an essential site that can potentially alter the allosteric dynamics of PTHR upon ligand binding.
(a) Distribution of ESSA z-scores for PTHR active conformer in the presence (red curve) or absence (blue curve) of PTH. Peaks indicate the essential sites. Residue ranges of the PTH, EC domain and TM helices are indicated along the upper abscissa, also delimited by different shades in the graph. TM residues E180, R181, D185, Y191, D241 and Y245 on TM1 and TM2 exhibit z-score above the threshold value of 1.0 (without peptide) (see Methods). Among them, R181 and Y245 exhibit peaks in both structures. Other peaks correspond to loop regions. Thus, R181 and Y245 stand out as essential TM sites that can modulate the global dynamics.
(b–c) Same results as in a, illustrated by color-coded diagrams side (top) and cytoplasmic-facing (bottom) views. Panel b shows a global hinge site (yellow dashed line) that corresponds to the blue peaks in A. High-to-low scores are color-coded from red-to-blue. The peptide PTH is shown in magenta ribbon in C. A significant increase in sensitivity is observed at the G protein binding region in the presence of PTH.
(d) Two hydrophobic pockets (wheat and gray) determined by Fpocket, surrounded by five of the essential residues detected by ESSA (without the peptide). See also Extended Data Figure 1.
(e) Structural elements identified by ESSA to potentially alter the essential dynamics of the receptor, color coded by ESSA score from red (z-score > 3) to blue (z-score close to zero). The analysis was performed for PTH-bound PTHR structure in an active state (PDB id: 6nbf) after modeling the missing loops.

