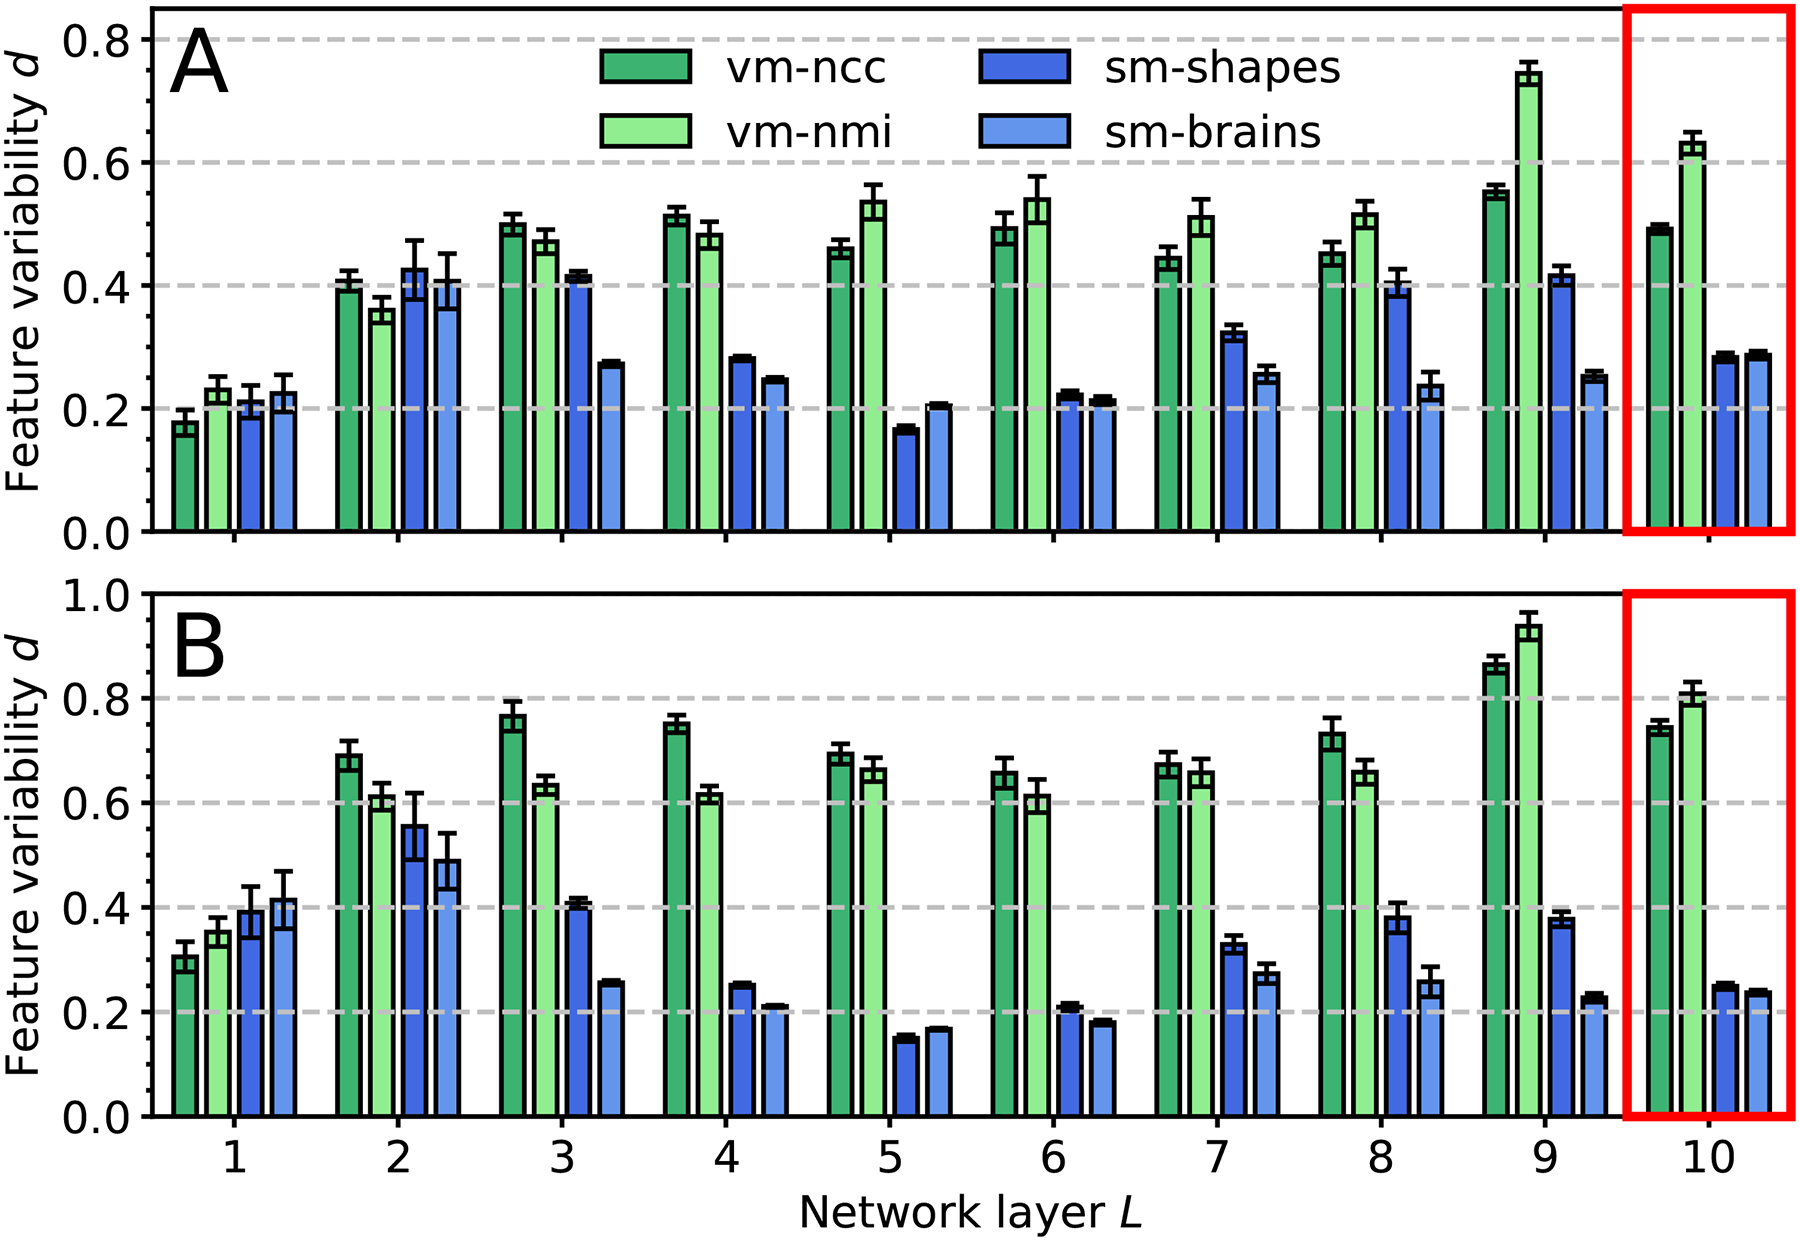
Fig. 12.

Feature variability for registration across (a) FLASH and (b) MPRAGE contrasts from 10 distinct subject pairs. We use normalized RMSD d between each contrast and the most T1w-like, averaged over contrasts, features, subjects. All models use the same architecture with n = 64 filters per layer. SynthMorph variants exhibit the least variability in the deeper layers (red boxes). Error bars show the standard error of the mean over features.
