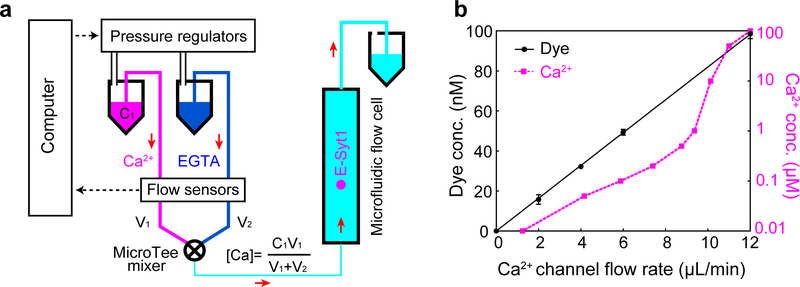
Extended Data Fig. 5. The microfluidic system to facilitate changes of the Ca2+ concentration in the single-molecule manipulation experiment.
(a) Schematics of the microfluidic system to change Ca2+ concentration when a single C2 repeat was being pulled. Two buffers containing 200 mM NaCl, 25 mM HEPES, pH 7.4, and 500 μM EGTA were prepared, one with CaCl2 (Ca2+ buffer) and another without CaCl2 (EGTA buffer). The two buffers were flowed through a mixer into the central flow cell. The two flows were independently controlled using computer-controlled pressure regulators (MS4-LR, Festo, NY) in combination with flow sensors (SLI-0430, Sensirion, Switzerland) that measure the flow rates. The constant flow rate was achieved by adjusting the pressure in the buffer vial through PID feedback control using a LabVIEW interface. The total calcium concentration in the flow cell ([Ca]), which consisted of both free and EGTA-chelated calcium, was determined by the total calcium concentration of the Ca2+ buffer ([Ca]=V1) and volume velocities of the two buffers (V1 and V2) before mixing. The free Ca2+ concentration ([Ca2+]) in the flow cell was calculated using Maxchelator (Web version v1.2) based on the total concentrations of calcium and EGTA. (b) The measured tracing dye concentration and predicted free Ca2+ concentration in the flow cell as the flow rate of the Ca2+ channel linearly increased from 0 to 12 μL/min while keeping the total flow rate of the two channels at 12 μL/min. To test the concentration change scheme, we added 100 nM rhodamine dye to the Ca2+ buffer and detected the concentration of the dye in the flow cell based on its fluorescence intensity measured by widefield fluorescence microscopy. We linearly increased the flow rate of the rhodamine-containing Ca2+ buffer from 0 to 12 μL/min and simultaneously decreased the flow rate of the EGTA buffer to keep the total flow rate of the two buffers to be 12 μL/min. The dye concentration linearly increased as expected, which justified our concentration change scheme. However, although the observation implied that the total calcium concentration in the flow cell varied linearly as predicted, the corresponding free Ca2+ concentration ([Ca2+]) responded in a nonlinear manner due to the buffering effect of EGTA. Combining with the flow control system, we detected C2 membrane binding transitions at constant force while changing Ca2+ concentration either continuously in the presence of a flow or stepwise in the absence of flow. While the former method allowed rapid [Ca2+] change at the expense of slight extra noise in force and extension measurements, the latter method permitted more accurate single-molecule measurement in the absence of flow after each [Ca2+] change (Fig. 4).

