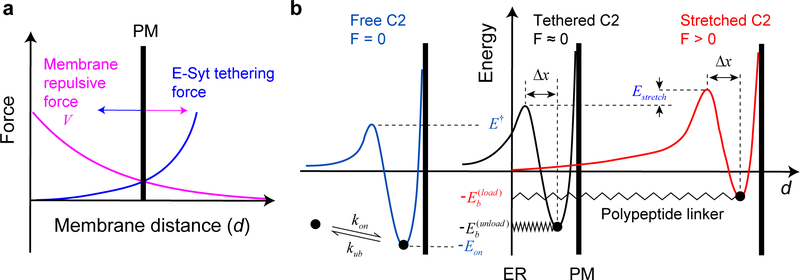
Extended Data Fig. 9. Calculations of equilibrium membrane distance and membrane binding energy and kinetics.
(a) Diagram illustrating the equilibrium membrane distance determined by the balanced membrane repulsive force (Eq. 6 in the main text) and E-Syt tethering force (Eq. 1). The equilibrium distance was solved as a solution for the system of equations where V' is the derivative of V(d) and h is the total length of the folded C2 modules in the pulling direction30 (estimated as 2 nm for each C2 module5,22). (b) Energy landscape corresponding to the C2-membrane interaction with the C2 module free in the solution (blue curve), tethered to the membrane by a flexible and relaxed polypeptide linker (black), or tethered to the membrane with a stretched linker (red). The three key parameters of the energy landscape associated with the free C2 module are determined from our single-molecule measurements (Supplementary Table 1). The energy landscape with the tethered and relaxed C2 module (corresponding to the force-unloaded C2 module) is determined by Eq. 3, with an effective concentration of the C2 module around the membrane estimated by Eq. 4. Note that the tethering does not affect the unbinding rate of the C2 module17. Stretching the bound C2 module by moving the PM membrane away from the ER membrane increases the energy barrier for C2 binding by Estretch and decreases the energy barrier for C2 unbinding by FΔx as indicated by Eq. 5.

