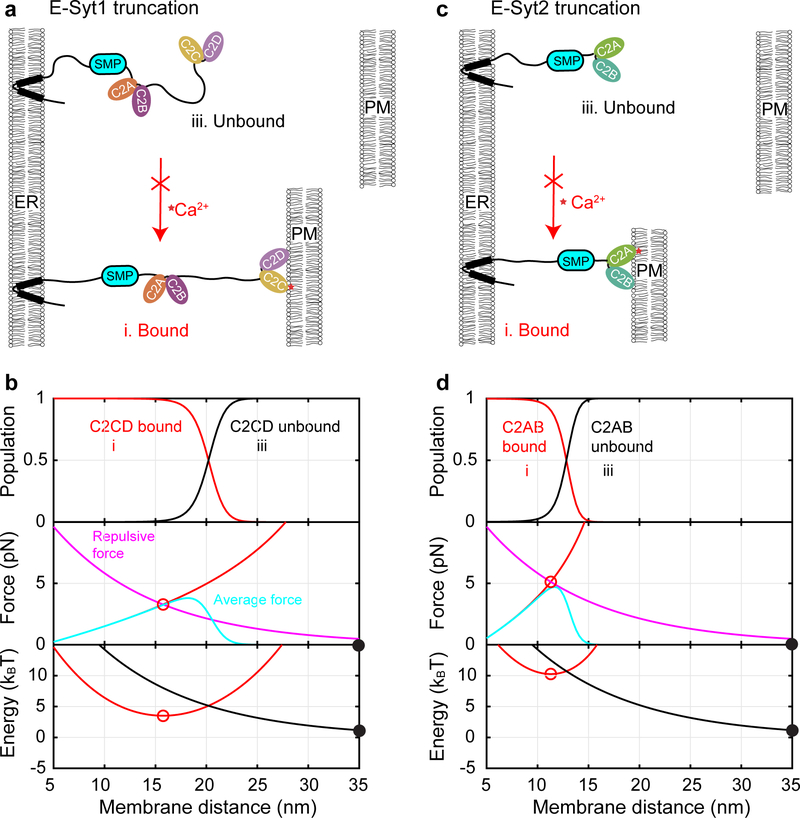
Extended Data Fig. 10. Calculated state probabilities, forces, and energy as a function of membrane separation due to potential trans-membrane binding of E-Syt1 (left panel) and E-Syt2 (right panel) lacking a membrane-binding C-terminal C2 module.
(a, c) Schematics of different C2 binding and membrane tethering states in the absence and presence of Ca2+ for E-Syt1 (a) or E-Syt2 (c). The calculations were to simulate the results of membrane contact formation from in vivo imaging using E-Syts with mutant C-terminal C2 domains (C2E in E-Syt1 or C2C in E-Syt2 and E-Syt3) that did not bind to membranes or with the domains truncated. (b, d) Calculated probabilities (top panel), average stretching force (middle), and free energy (bottom) of different states for truncated E-Syt1 (b) or E-Syt2 (d). Calculations corresponding to the presence of Ca2+ or the absence of Ca2+ are indicated by solid and dashed lines, respectively, with their colors indicating different states as shown in a or b: red for the bound state I and black for the unbound state iii. Stable and unstable states are indicated by solid and hollow circles, respectively. The derived equilibrium distances and free energy are shown in Supplementary Table 3.

