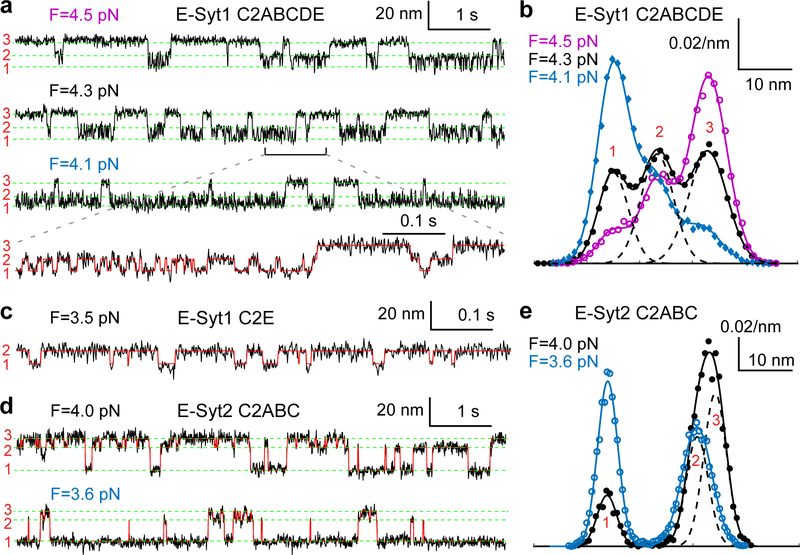
Fig. 2. E-Syt C2 domains reversibly and sequentially bind to membranes.
(a, c, d) Extension-time trajectories at constant mean force F for the C2 repeat E-Syt1 C2ABCDE (a), E-Syt1 C2E (c), or E-Syt2 C2ABC (d). The average extensions of three states (numbered on the left as in Fig. 1d) are marked by green dashed lines. A close-up view of the indicated region in the second trajectory in a is shown in the fourth trajectory. The overlaying red trace represents an idealized state transition derived from hidden-Markov modeling (HMM), as in other extension-time trajectories. (b, e) Probability density distributions of the extensions shown in a or d (symbols) and their best fits with a sum of three Gaussian functions (solid curves), with the individual Gaussian functions shown as dashed curves for the black curves.

