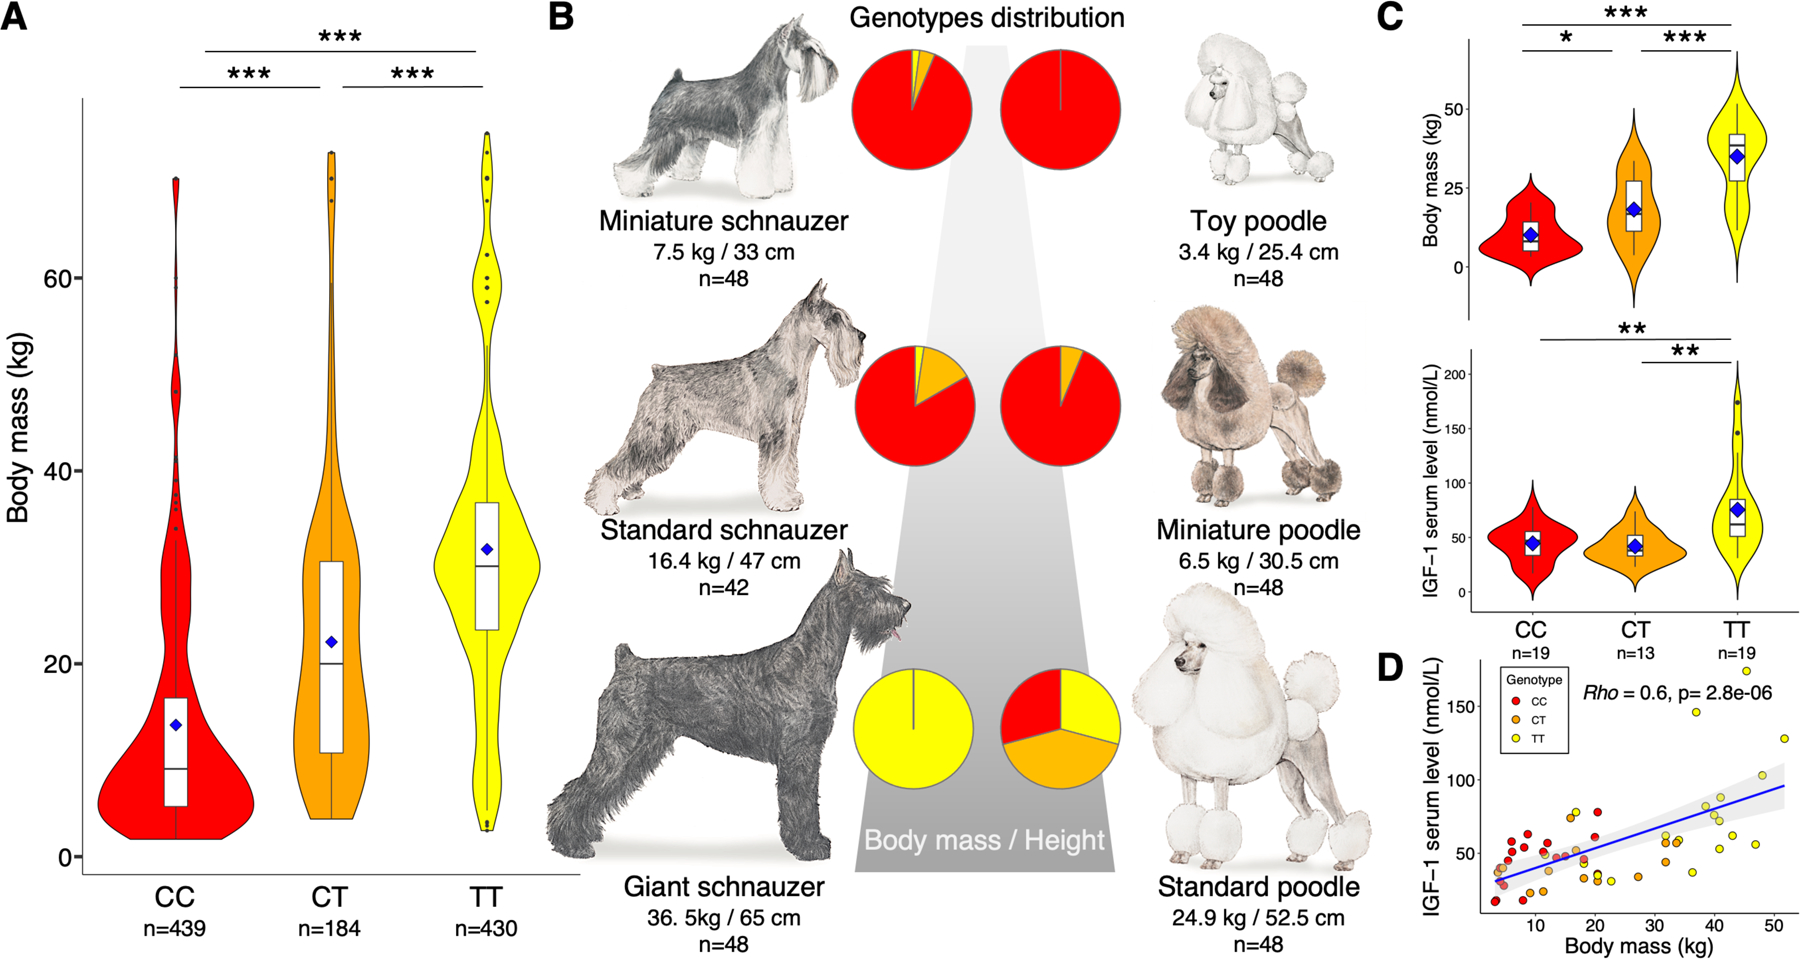
Figure 1. Insulin-like growth factor 1 (IGF1) in Canidae.

(A) IGF1-AS variant genotypes and body mass range collected from 1,162 dogs of 230 breeds. Dots represent outliers. Blue diamonds indicate breed body mass averages, boxplots represent interquartile ranges and black horizontal bars show median for each (***P < 0.0001, Mann–Whitney–Wilcoxon tests). (B) Distribution of IGF1-AS alleles in three schnauzer breeds and poodle varieties. Pie chart indicates population proportion based on genotypes. Red=CC, orange=CT, and yellow=TT. (C) Body mass and serum levels of IGF-1 protein (nmol/L) as functions of IGF1-AS genotype. IGF-1 serum protein levels were assayed in 51 dogs, including 13 mixed-breed dogs (*P<0.01, **P<0.001, ***P < 0.0001, Mann–Whitney–Wilcoxon tests); (D) Positive correlation observed between body mass and IGF-1 serum level (Rho Spearman test). Blue line shows the regression line, grey area represents confidence interval. See also Table S1 and Data S1.
