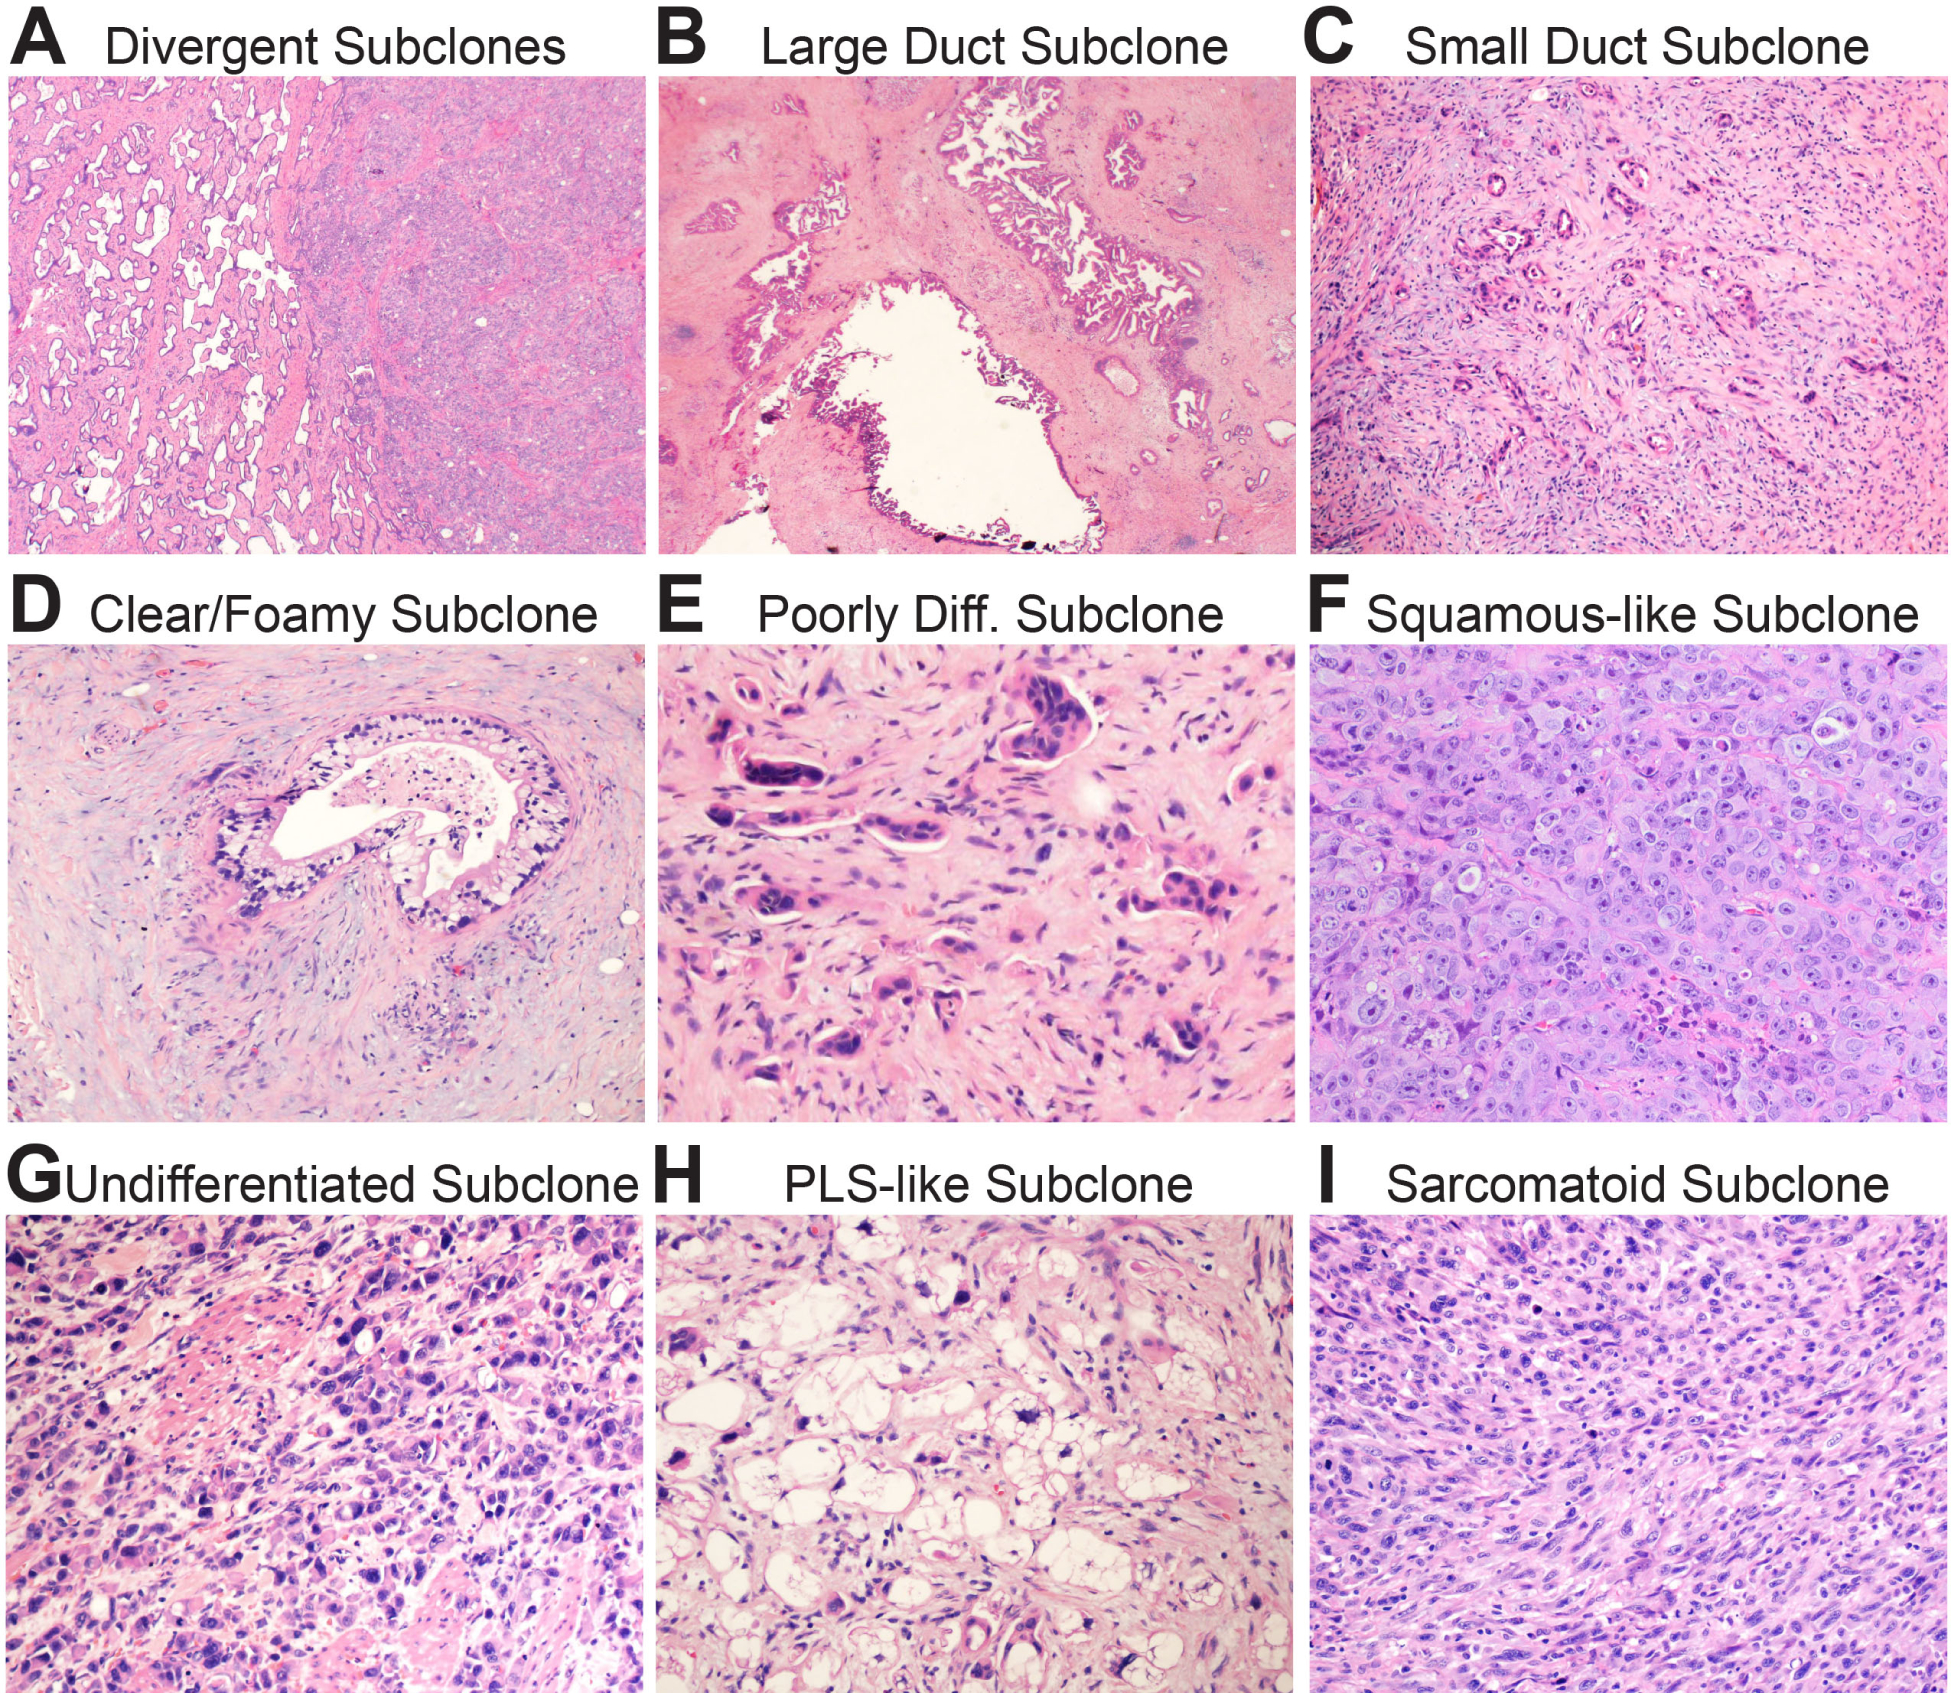
Fig. 4.

Biomorphology of subclonal evolution. (A) Low power magnification shows a well-differentiated (classic) glandular subclone on the left and a poorly differentiated squamous-like subclone on the left. Note the sharp boundary between them. (B) Low power magnification of a large duct subclone. The ducts are often as large as the main pancreatic duct. (C) Low power magnification of a small duct subclone. The ducts are so small they may be difficult to see at low power. (D) High power magnification of a clear/foamy gland subclone with characteristic pale cytoplasm and raisinoid nuclei. (E) High power magnification of a poorly differentiated subclone. Note small clusters and single cells infiltrating in the stroma. (F) High power magnification of a squamous-like subclone. The tumour in this example grows as sheets of poorly differentiated pink cells with little intervening stroma. These subclones usually express patchy p63 by immunohistochemistry. (G) High power magnification of an undifferentiated subclone. The cells are discohesive and do not form glands or nests. (F) High power magnification of a pleomorphic liposarcoma (PLS)-like subclone. This is a variant I have occasionally noticed in practice. (G) High power magnification of a sarcomatoid subclone. The overtly malignant spindle cells are tightly packed with little intervening stroma.
