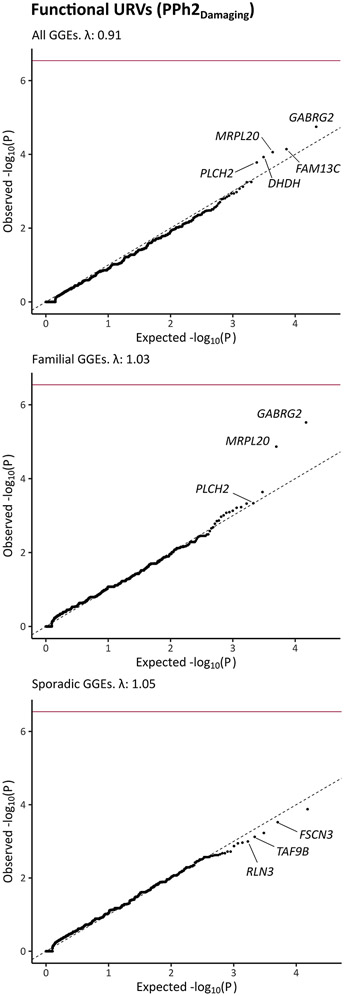
Fig. 1: Association of ultra-rare variation in protein coding genes with genetic generalized epilepsy.
The quantile-quantile plots compare the observed p values (Cochran-Mantel-Haenszel exact test) and the expected p values (drawn from a uniform distribution) in analyses of 1,928 individuals genetic generalized epilepsies (GGEs) in comparison to 8,578 matched controls (top panel) as well as subsequent analyses of familial GGEs (middle panel; 945 cases and 8,626 controls) or sporadic GGEs (bottom panel; 1,005 cases and 8,621 controls). These analyses focused on functional ultra-rare variants (URVs; with minor allele frequencies < 0.05% in the test dataset & not seen in DiscovEHR/gnomAD) that were annotated as predicted Loss-of-Function variants (pLoF), damaging missense variants with Polyphen2 (PPh2), or in-frame insertions and deletions. Study-wide significance after Bonferroni correction (dark red line) was defined by a p value < 2.9 x 10⁻⁷. λ: Genomic inflation factor. Among the five top-ranked genes, genes that had a higher carrier frequency in cases vs. controls in both study datasets are labeled (not labeled among top-ranked: enriched in controls or in cases in one dataset only).

