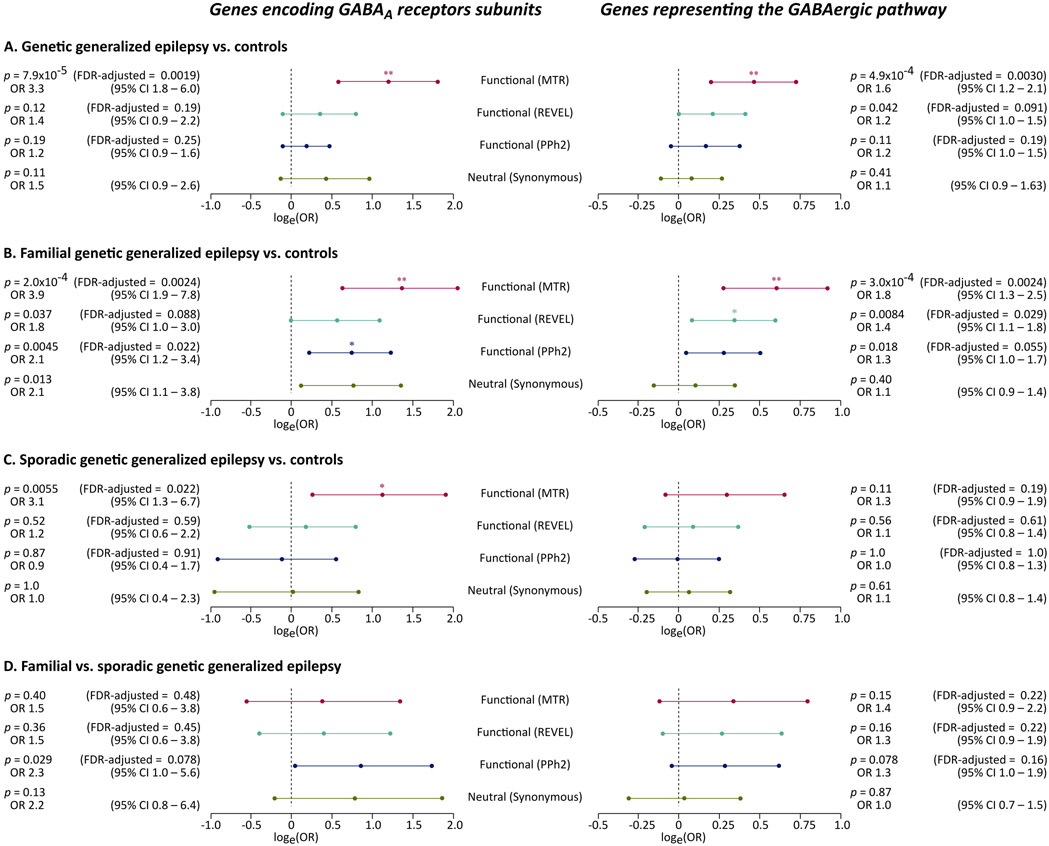
Fig. 2: Association of ultra-rare variation in genes encoding GABAA receptors with familial and sporadic genetic generalized epilepsy.
The forest plots show the association of ultra-rare deleterious and intolerant variants with the phenotype in analyses of 1,928 individuals with GGE vs. 8,578 controls (A), 945 individuals with familial GGE vs. 8,626 controls (B), 1,005 individuals with sporadic GGE vs. 8,621 controls (C), and a direct comparison of 945 individuals with familial GGE vs. 1,005 individuals with sporadic GGE (D). Four (primary and control) ultra-rare variant models are shown (y axis). The association in each analysis is displayed as the natural logarithm of stratified odds ratio from a Cochran-Mantel-Haenszel exact test (x axis). Errors bars indicated the logarithm of the 95% confidence intervals (CI). The corresponding odds ratios and associated p values, and False Discovery Rate (FDR) adjusted p values are displayed on the side. The tests for synonymous variants were not adjusted for multiple testing.

