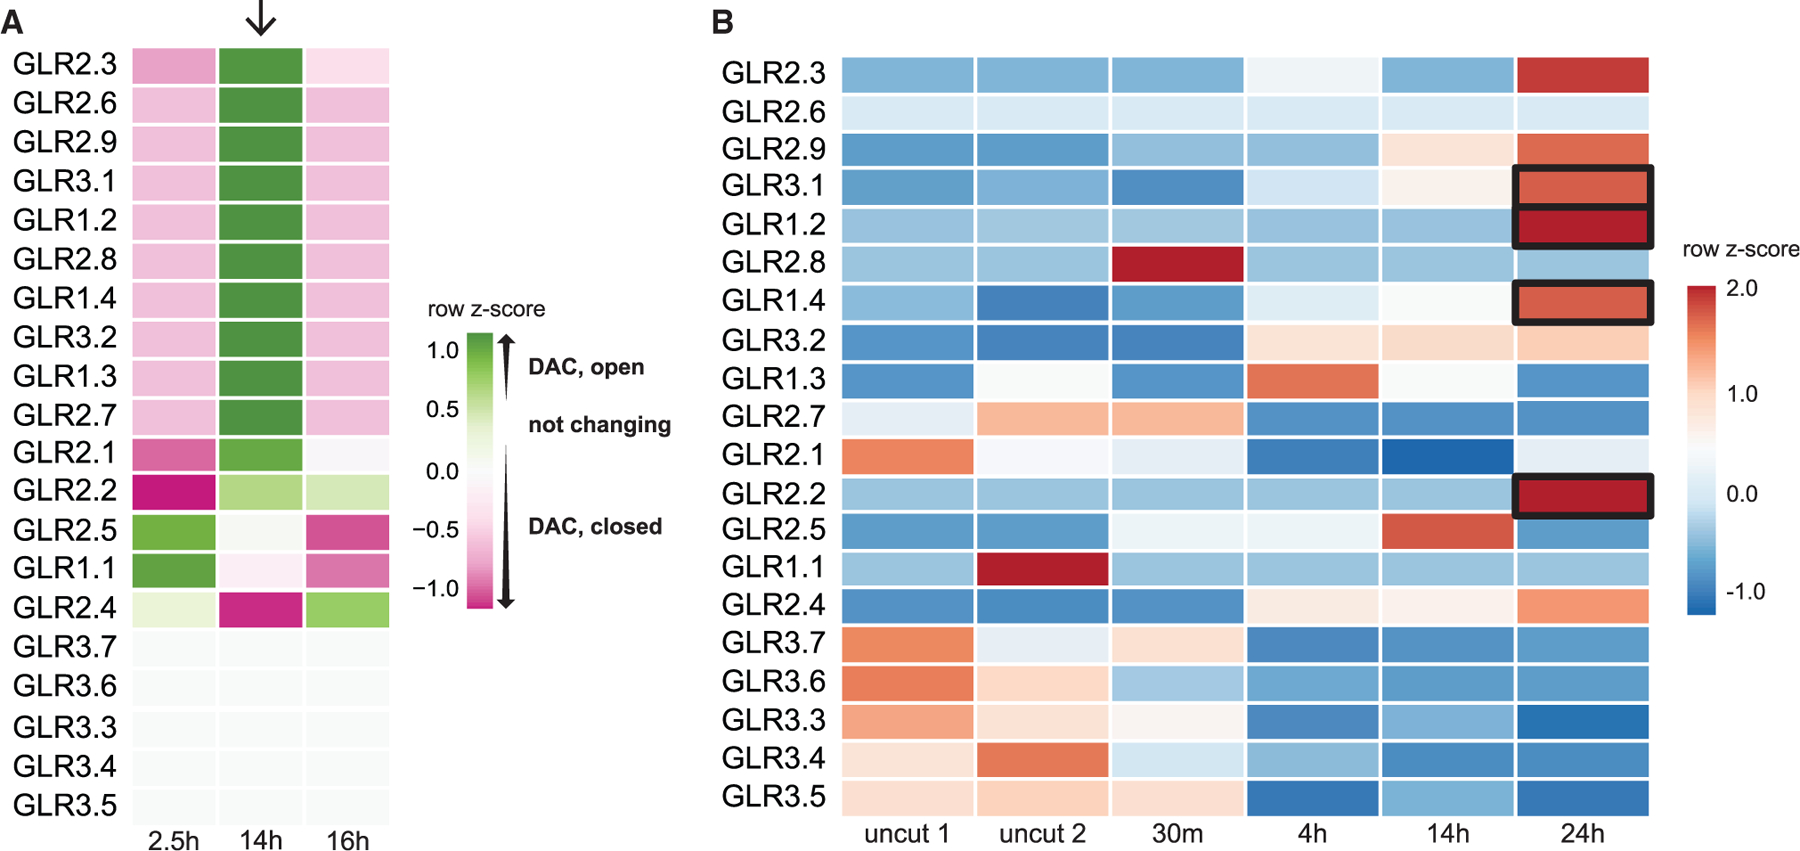
Figure 2. The GLR family undergoes rapid chromatin modification and transcriptional regulation.

(A) Heatmap showing trends in chromatin accessibility among GLRs during regeneration at three time points representing hours post cut. Color represents the relative accessibility (per ATAC-seq analysis in Figure 1B) as a row Z score, which is standard deviations from the row mean. Arrow points to a trend of opening chromatin at 14 h among a subset of GLRs.
(B) Heatmap depicting GLR transcriptional analysis from RNA-seq profiles in a time course of uncut and regenerating root stumps at four time points after cutting (row Z score followed by log2 normalization). Boxes highlight several GLRs that increase in expression during the first 24 h of regeneration and whose chromatin becomes more accessible.
