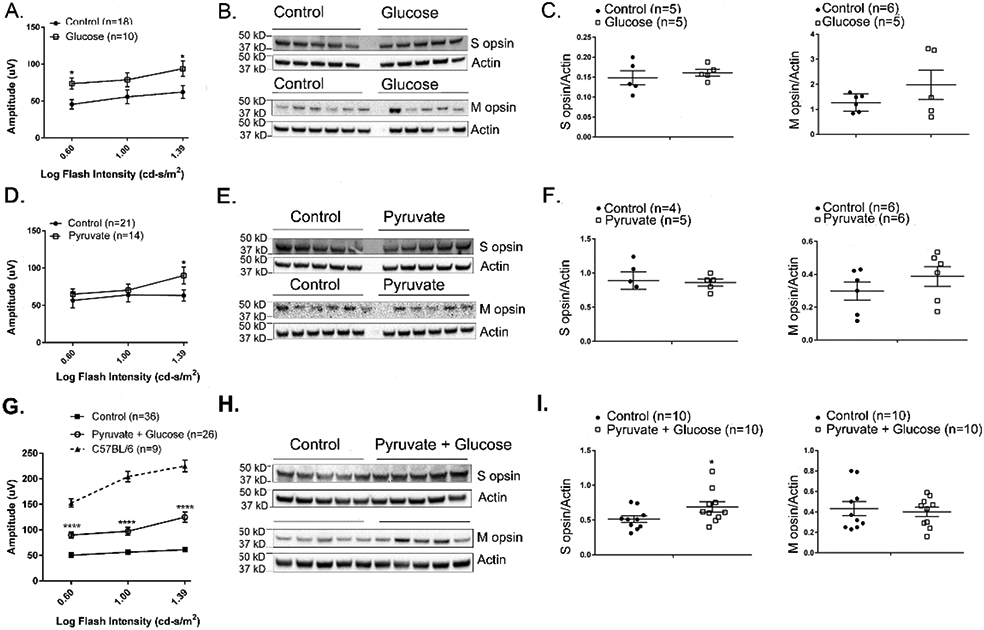
Figure 3. Dietary supplementation with glucose and pyruvate improves retinal function in rd10 mice.

Starting at P8, rd10 mice were given normal drinking water (control) or drinking water supplemented with 42 mM glucose, 10 mM pyruvate, or both. (A) At P50, mean photopic b-wave amplitude was significantly higher at 2 flash intensities in eyes of mice treated with glucose (n=10) compared with their corresponding control group (n=18). (B) Immunoblots of retinal homogenates of P50 rd10 mice treated with glucose and their corresponding controls probed with antibodies directed against S or M cone opsin. (C) Densitometry of blots in (B) showed no difference in S opsin/Actin ratio or M opsin/Actin ratio between glucose-treated versus control rd10 mice. (D) Mean photopic b-wave amplitude was significantly higher only at the highest flash intensity in eyes of P50 rd10 mice treated with pyruvate (n=14) compared with their corresponding control group (n=21). (E) Immunoblots of retinal homogenates of P50 rd10 mice treated with pyruvate and their corresponding controls probed with antibodies directed against S or M cone opsin. (F) Densitometry of blots in (E) showed no difference in S opsin/Actin ratio or M opsin/Actin ratio between retinas from pyruvate-treated versus control rd10 mice. (G) Mean photopic b-wave amplitude was significantly higher at 3 flash intensities in eyes of P50 rd10 mice treated with 10 mM pyruvate and 42 mM glucose (n=26) compared with their corresponding control group (n=36). Mean photopic b-wave amplitude of C57BL/6 mice at P50 are also shown. (H) Immunoblots of retinal homogenates of P50 rd10 mice treated with pyruvate and glucose and their corresponding controls probed with antibodies directed against S or M cone opsin. (I) Densitometry of blots in (H) showed a significant increase in S opsin/Actin ratio (0.0399), but not M opsin/Actin ratio between retinas from rd10 mice treated with 10 mM pyruvate and 42 mM glucose versus control rd10 mice.
* p ≤ 0.05, *** p ≤ 0.001, **** p ≤ 0.0001 by Mann-Whitney test.
