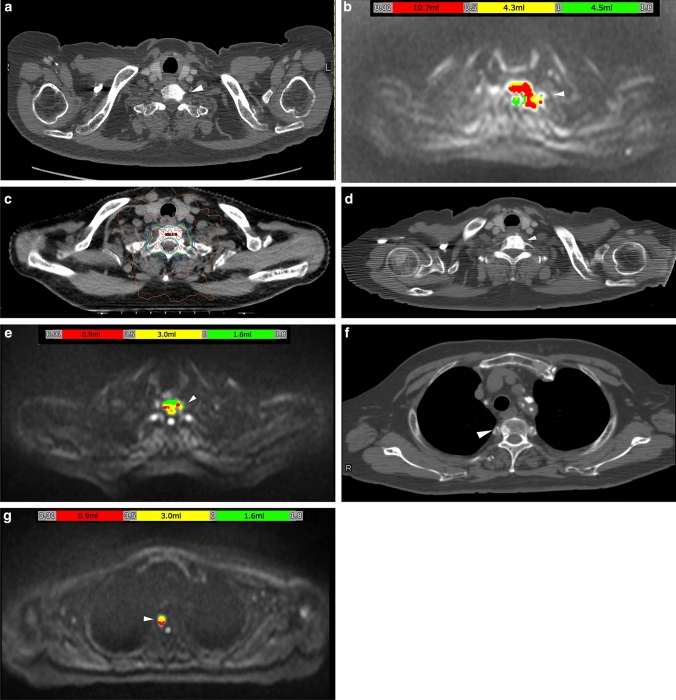
Fig. 8.
A 70-year-old man with CRPC. Six years ago, local radiotherapy was performed for prostate cancer (T2c N0M0, PSA 32.1 ng/mL, GS 4 + 5). Four years later, the patient’s condition transitioned to CRPC. a On the original axial CT at the level of C7, osteosclerotic change was seen in the left part of C7 body (white arrowhead). At that time, the patient’s PSA level was 4.413 ng/mL. b On the BD score–composed axial image at the level of C7, a colored area was seen (white arrowhead). tDV was 19.5 mL, and the mean ADC value was 0.74 (× 10–3 mm2/s). c The C7 lesion was regarded a metastatic lesion, intensity-modulated radiation therapy was performed (35 Gy/5fr RT.) with reference to the axial DW image. d–g Approximately 10 months after the image shown in a–c, PSA increased to 6.235 ng/mL. d On the original axial CT at the level of C7, the osteosclerotic change increased in the left part of the C7 body (white arrowhead) from that shown in a. e On the BD score–composed axial image at the level of C7, a colored area was seen (white arrowhead). The colored area decreased from that in b. f On the CT image at the level of Th3, a subtle sclerotic change was newly observed (white arrowhead), but this was a retrospective finding. g On the BD score–composed axial image at the level of Th3, a colored area was newly observed in the right part of the body (white arrowhead). In this case, tDV decreased to 5.5 mL, and consequently, mean ADC increased to 0.83 (× 10–3 mm2/s); however, Th3 was diagnosed as a new metastatic lesion

