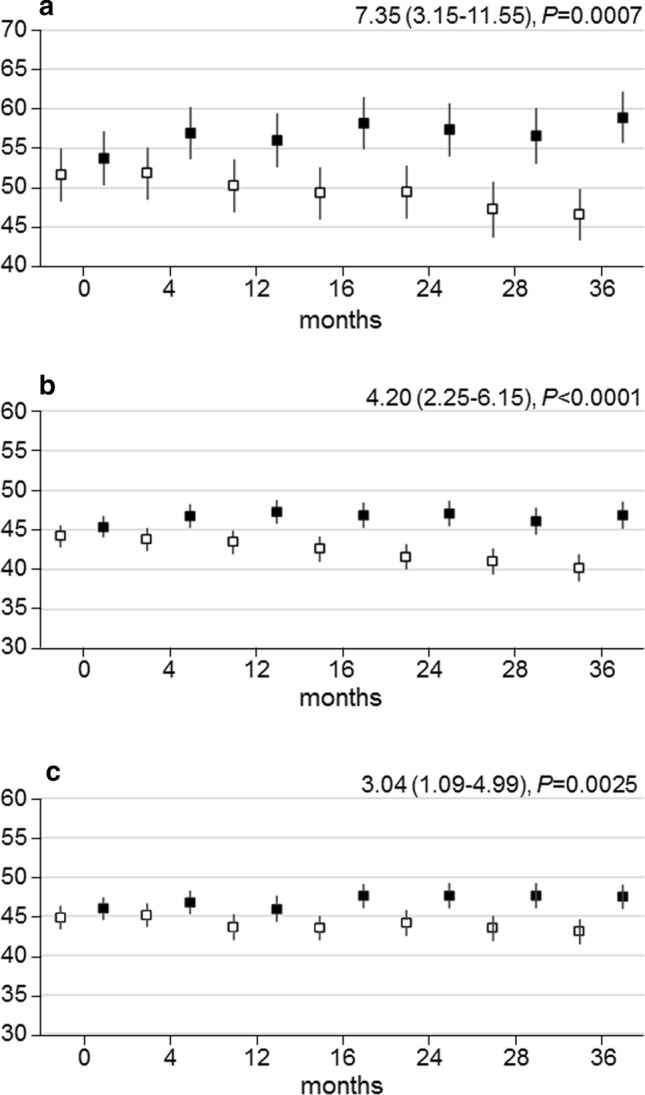
Fig. 2.

WHO-5, PCS and MCS scores over time. Change over time in WHO-5 (a), PCS (b) and MCS (c) scores in participants in the INT (black boxes) versus CON (white boxes) group. Data [estimated mean with 95% confidence interval (CI)] were calculated on the basis of questionnaires filled in at scheduled visits. The analyses are based on a mixed model for repeated measurements, taking into account within-participant correlation. P values were calculated with a mixed model for repeated measurements. Estimated mean differences over time with 95% CIs and P values between INT and CON are reported at the top right. WHO World Health Organization, PCS physical component summary, MCS mental component summary, CON control group, INT intervention group
