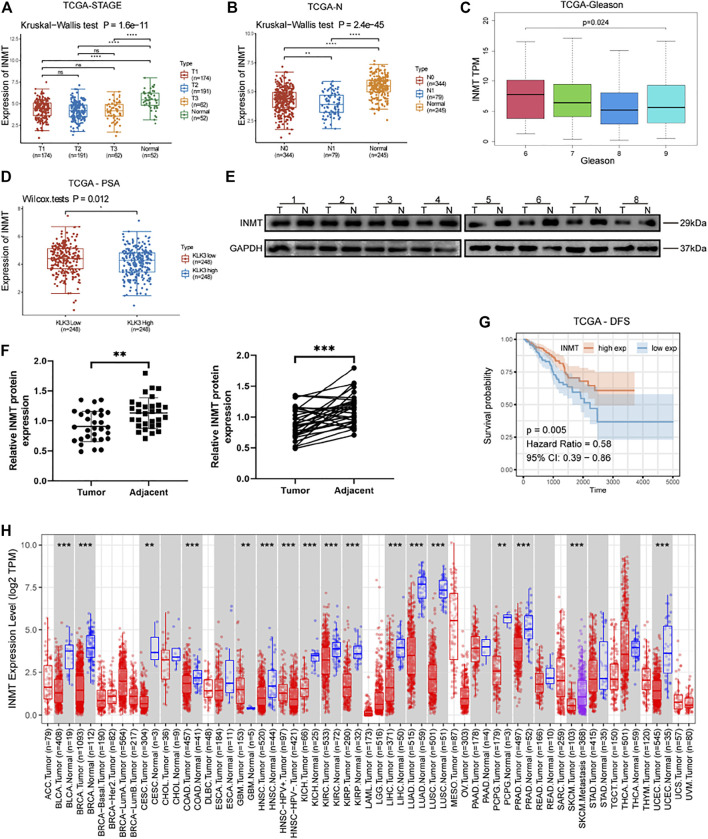
FIGURE 1.
(A) Expression of INMT in three clinical stages and normal prostate tissues of TCGA-PRAD (p = 1.6e−11), Tx classification according to TNM stage of prostate cancer (AJCC, 2017). (B) The expression of INMT in various lymph node metastasis groups and normal tissues of TCGA-PRAD (p = 2.4e−45). (C) The expression of INMT in various Gleason score groups of TCGA-PRAD (p < 0.001). (D) The expression of INMT in the high PSA and low PSA groups of TCGA-PRAD (p = 0.012). (E,F) The expression of INMT protein in 30 pairs of clinical samples of prostate cancer (T) and adjacent non-cancerous prostate tissues (N) (p < 0.001). (G) Using survival analysis, we found that the disease-free survival time in the INMT high-expression group was significantly longer than in the INMT low-expression group in TCGA-PRAD (p = 0.005, Hazard Ratio = 0.58). (H) Pan-cancer analysis of the TIMER database showing the expression level of INMT in cancer tissues.

