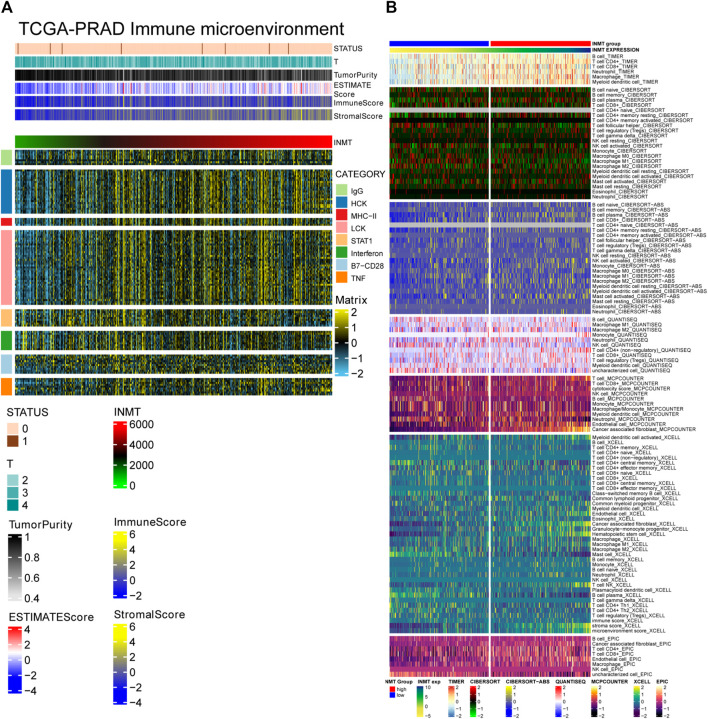
FIGURE 5.
(A) Correlation between the expression level of INMT and tumor stage, tumor purity, ESTIMATE score, immune score, stormal score and immune response intensity (expression of eight immune-related genes). (B) The proportion of different immune cells in the two subgroups of INMT expression based on TIMER, CIBERPORT, CIBERPORT-ABS, QUANTISEQ, MCPcounter, XCELL and EPIC algorithms.

