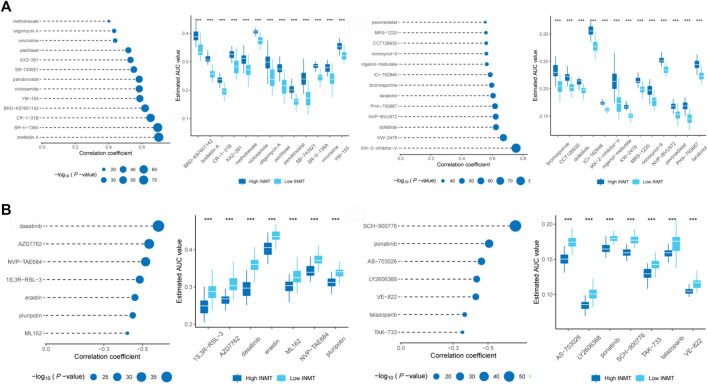
FIGURE 6.
Identification of candidate agents with high drug sensitivity in patient groups with various INMT expression levels. Based on CTRP and PRISM datasets, (A) Spearman correlation analysis found that the AUC values of 26 compounds were positively correlated with the expression of INMT, (B) while the AUC values of 14 compounds were negatively correlated with the expression of INMT. Note that the lower the value on the Y-axis of the box plot, the higher the drug sensitivity.

