Figure 4.

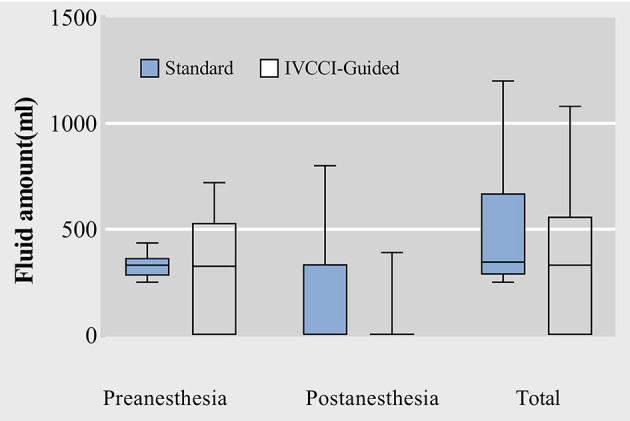
Box plots of raw data for preanesthesia, postanesthesia and total fluid amount administrated. Data are median (central line) and interquartile range (box margins).

Box plots of raw data for preanesthesia, postanesthesia and total fluid amount administrated. Data are median (central line) and interquartile range (box margins).