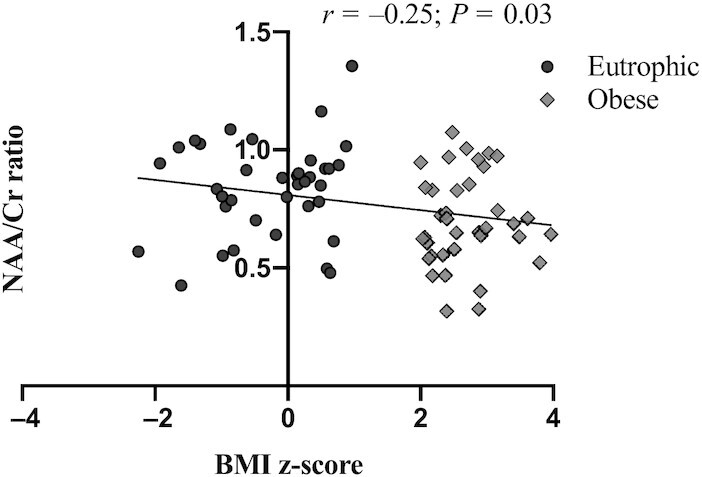
FIGURE 2.

BMI z-score correlations to NAA/Cr ratio within the entire cohort. Significant differences were tested using Pearson coefficients (r) within the entire cohort [eutrophic (n = 37) and obese (n = 37)]. Cr, creatine; NAA, N-acetylaspartate; r, correlation coefficient.
