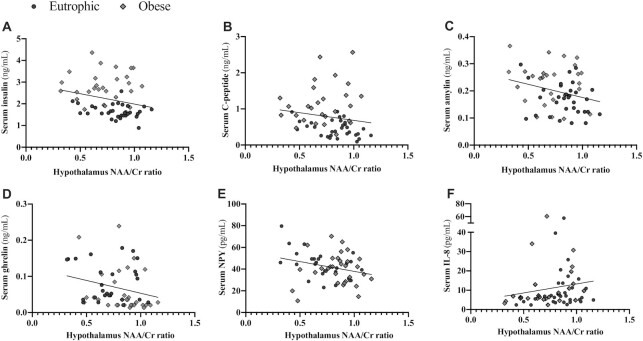
FIGURE 3.
NAA/Cr ratio, cytokines, hormones, and neuropeptides’ significant correlations within the entire cohort. (A) Serum insulin and hypothalamus NAA/Cr ratio correlation; (B) serum C-peptide and hypothalamus NAA/Cr ratio correlation; (C) serum amylin and hypothalamus NAA/Cr ratio correlation; (D) serum ghrelin and hypothalamus NAA/Cr ratio correlation; (E) serum neuropeptide Y and hypothalamus NAA/Cr ratio correlation; and (F) serum IL8 and NAA/Cr ratio correlation. Significant differences were tested using Pearson coefficients (r) or nonparametric Spearman correlation (rho) within the entire cohort [eutrophic (n = 37) and obese (n = 37)]. Significance was considered at a P value < 0.05. Cr, creatine; NAA, N-acetylaspartate.

