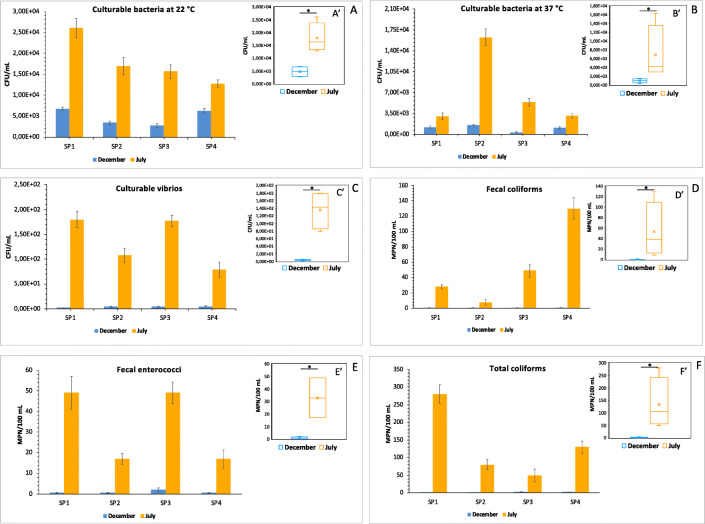
Fig. 2.
Histograms showing concentrations of culturable bacteria in seawater samples collected in December and July. Bacterial counting is reported as mean values ± S.D. of three replicate plate counts at the four sampling points (SP1, SP2, SP3, SP4). Bacterial counts are expressed as CFU/mL for culturable bacteria at 22 °C (a), culturable bacteria at 37 °C (b), and culturable vibrios (c) and as MPN/100 mL for fecal coliforms (d), fecal enterococci (e), and total coliforms (f). In a′–f′, concentration values reported in box-plots for December and July samples correspond to mean values of three replicate plate counts for each sampling point (SP1-4). The asterisk (*) indicates a p value

