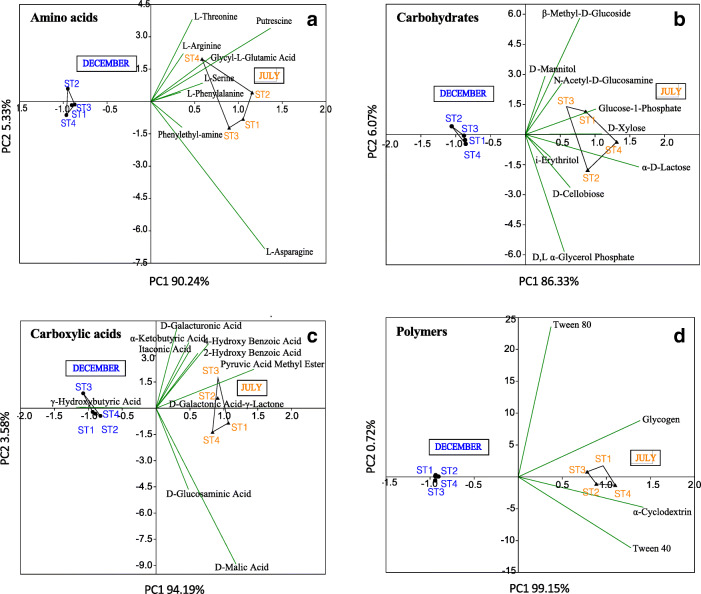
Fig. 5.
Two-dimensional Principal Component Analysis (PCA) of microbial metabolic parameters for the December and July analyzed samples. a Amino acids, b carbohydrates, c carboxylic acids, and d polymer utilization. The input data is a matrix of multivariate data, with sampling groups (n=4 per group) in rows and carbon sources in columns. December and July samples are reported by black full dot and black full triangle, respectively. The percentages of the total variance explained by the first and second principal component (P1 and P2, respectively) are also indicated in each plot

