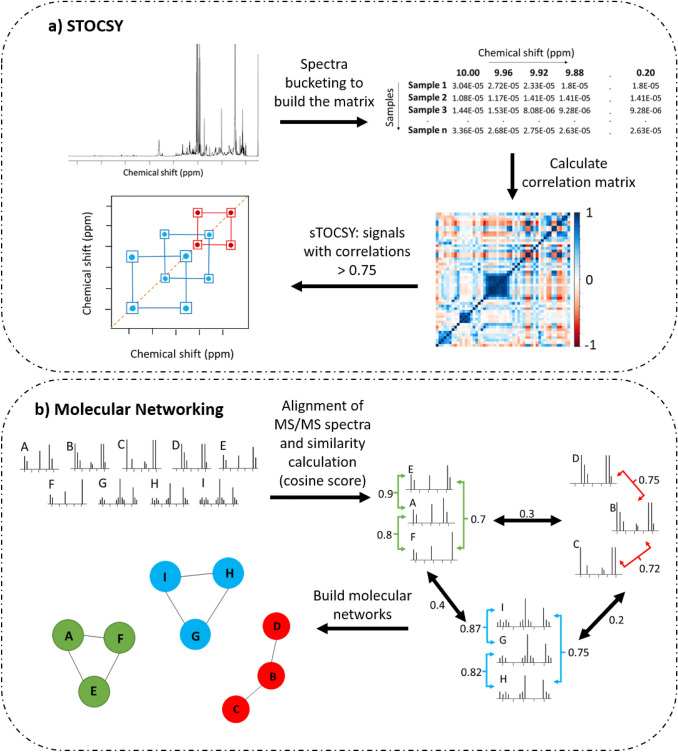
Fig. 1.
Comparison of the workflows of a STOCSY (statistical total correlation spectroscopy) and b Molecular networking. a The correlation matrix shows the correlation values. Those with correlation values above 0.75 are plotted in the spectra. In red are the correlations that are also present in TOCSY spectra as a result of chemical bonds, and in blue are the correlations between signals that are not chemically bonded. b Shows the alignment of MS/MS spectra and calculation of the similarity cosine score, features with scores above 0.7 are connected
adapted from Watrous et al. (2012)

