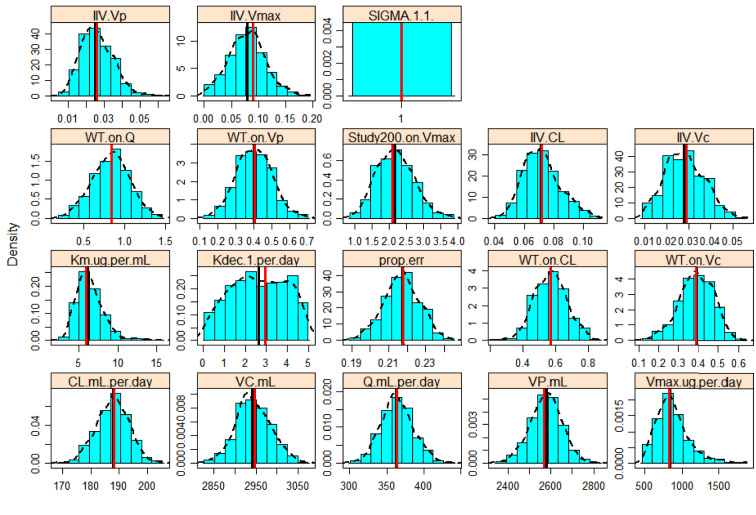
Fig. 3.
Distributions of parameter estimates via bootstrapping (model 5). The red line indicates the original estimates from model 5, the vertical black line indicates the median of 1000 bootstrapped samples. The values of SIGMA.1.1 and VMAXSTUDY1102 were not estimated. The effect of study 1102 on Vmax was evaluated by pooling with the pharmacokinetic data from study 1155. Kdec was estimated by division with 1000 (e.g., the value of 3 in the Kdec plot corresponds to estimated Kdec of 0.003 1/day). CL clearance, IIV interindividual variability, Kdec first-order rate constant for decrease in Vmax, Km concentration to achieve half of Vmax, prop.err proportional error, Q intercompartmental clearance, Vc volume of distribution in the central compartment, Vmax maximum velocity of the saturable clearance process Vp volume of distribution in the peripheral compartment, WT body weight

