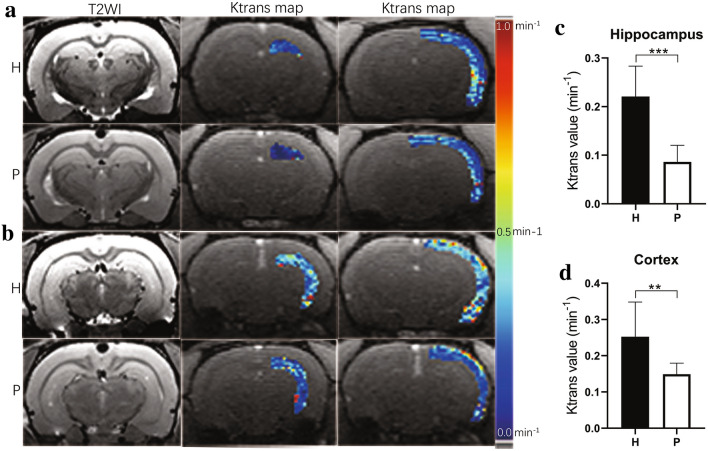
Fig. 6.
BBB permeability increase in the hippocampus and ipsilateral cortex of H group rats. a Hippocampus and cortex of H and P group rats at − 3.60 mm relative to the anterior commissure (slice 1). b Hippocampus and cortex of H and P group rats at − 5.60 mm relative to the anterior commissure (slice 2). Left column shows hippocampus and cortex on T2WI. Middle column shows Ktrans maps of hippocampus. Right column shows Ktrans maps of cortex. Color-coded Ktrans ranged between 0.0 and 1.0 min−1, with dark blue indicating 0.0 min−1, green indicating 0.5 min−1, and red indicating 1 min−1. c Ktrans of the right hippocampus of H and P group rats. d Ktrans of the right cortex of H and P group rats. Data are expressed as the mean ± SD (n = 12 per group). H plateau hypoxia, P plain, BBB blood–brain barrier, Ktrans volume transfer constant. **P < 0.01, ***P < 0.001

