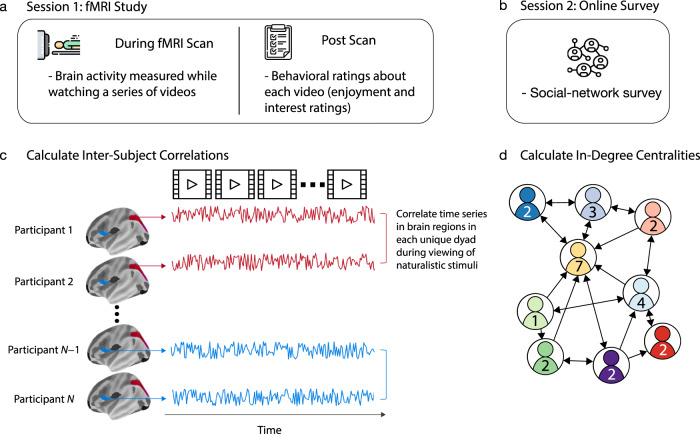
Fig. 1. Study paradigm and calculations.
a Schematic of the fMRI study paradigm. In session 1 of the study, participants attended an in-lab session in which their brain activity was measured using fMRI while they watched a series of naturalistic stimuli (i.e., videos). After the fMRI scan, the participants provided ratings on how enjoyable and interesting they found each video. b Schematic of our social-network survey. In session 2 of the study, participants completed an online social-network survey in which they indicated the individuals in their residential community with whom they were friends. c Schematic of neural similarity. We extracted the time series of neural responses that were obtained as participants viewed the stimuli. We then calculated inter-subject correlations (ISCs) of these time series for each of 214 brain regions. d Schematic of our network calculations. Based on the participants’ responses in (b), we constructed two directed, unweighted networks—with one for each residential community—in which each node represents an individual and each directed edge represents one individual nominating another as a friend. For each individual, we calculated in-degree centrality, which counts the number of times that that individual was nominated as a friend by others in their own residential community.

