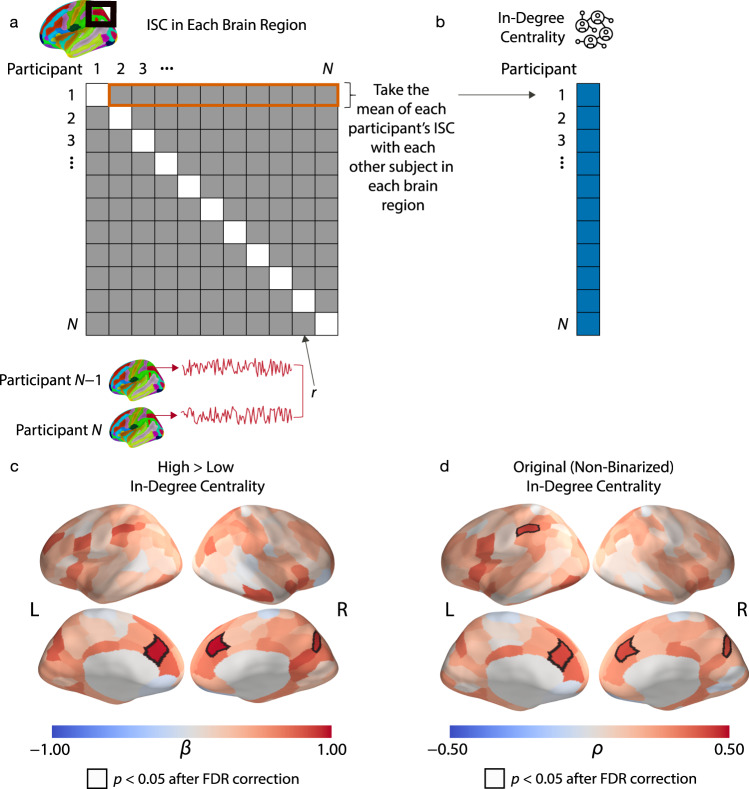
Fig. 2. Participant-level analysis.
a Our approach for participant-level analysis. First, we Fisher z-transformed the dyad-level ISCs, which are encoded by a matrix of pairwise Pearson correlation coefficients (which we denote by r). We then computed the mean of each participant’s ISC with each other participant. (In other words, we took the mean of each row of the matrix.) We performed the above calculations for each of the 214 brain regions. This yields one ISC value for each participant for each brain region. The ISC value encodes the mean similarity of the neural responses between the participant and each other participant in the corresponding brain region. b We tested for relationships between the participants’ in-degree centralities and these participant-level ISC values in each brain region. c Our results that relate mean ISCs with the binarized in-degree centrality variable indicated that individuals with high in-degree centralities had much larger mean neural similarities with their peers in the bilateral DMPFC and precuneus than individuals with low in-degree centralities. d Our results that relate mean ISCs with the original (i.e., non-binarized) in-degree centrality values gave similar results as the analysis in (c). We found that the mean ISCs in the bilateral DMPFC, precuneus, and the superior parietal lobule were positively correlated with in-degree centrality. The quantity β denotes the standardized regression coefficient, and ρ denotes the Spearman rank correlation. All results are FDR-corrected at p < 0.05, which corresponds to an uncorrected p-value of 0.009 in (c) and an uncorrected p-value of 0.001 in (d). All of the reported p-values are two-tailed. Source data are provided as a Source Data file.

