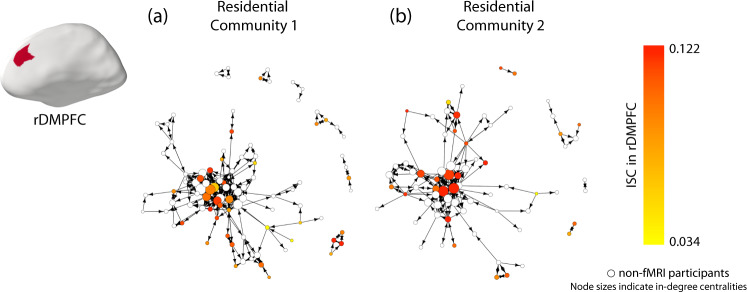
Fig. 3. Visualization of participant-level ISC results in the social networks.
Visualizations of the social networks of (a) residential community 1 and (b) residential community 2 of a first-year dorm. Each participant was a resident of one of two distinct residential communities, where one “community” consists of the set of people who live in the same wing and floor of a residence hall. Each node (which we show as a disc) represents one resident who was living in one of the communities, and each line segment represents one directed edge between two nodes if it is unidirectional and represents two directed edges if it is bidirectional. For example, an arrow from node A to node B conveys that node A nominated node B as a friend. An edge with two arrowheads indicates a mutually nominated friendship. The size of a node represents its in-degree centrality, with larger nodes indicating individuals with higher in-degree centralities. The color of the nodes represents a node’s mean neural similarity in the rDMPFC to other members of its residential community, with darker colors indicating greater neural similarities. As this figure indicates, individuals with higher in-degree centralities (i.e., individuals who many other individuals nominated as a friend) tended to have the largest mean ISCs with their peers in the rDMPFC. Source data are provided as a Source Data file.

