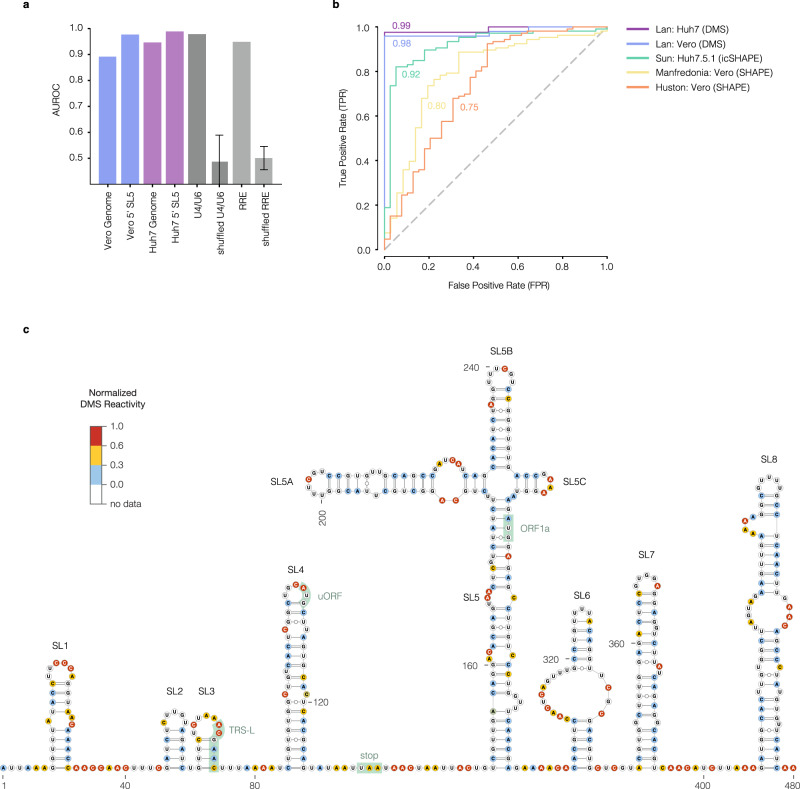
Fig. 2. Quality assessment of the SARS-CoV-2 secondary structure model.
a Agreement between DMS reactivities and predicted structures for the Vero and Huh7 genomes, and the consensus structure of 5′ untranslated region (UTR) stem–loop 5 (SL5; coordinates 150–294), measured as the area under the receiver operating characteristic curve (AUROC). AUROC values between DMS-MaPseq data and well-established structures are also shown for two positive control RNAs: U4/U6 snRNA and HIV-1 Rev Response Element (RRE). As negative controls, n = 100 shuffled datasets were generated by randomly permuting the DMS reactivities and recomputing the AUROC. Data are presented as means ± SD. b Receiver operating characteristic (ROC) curves comparing the literature consensus structure of SARS-CoV-2 SL5 (coordinates 150–294) with DMS/SHAPE reactivities from our datasets and those from other authors. Each AUROC value is shown next to its ROC curve. For each dataset, the first author, cell type, and chemical probe are indicated. c Model of the first 480 nt of the SARS-CoV-2 genome (including the 5′ UTR, coordinates 1–265) based on DMS reactivities from Vero cells. Nucleotides are colored by normalized DMS reactivities. Highlighted features include stem–loops (SL) 1–8, the leader TRS (TRS-L), the start codons of the upstream ORF (uORF) and ORF1a, and the stop codon of uORF. Source data are provided as a Source Data file.

