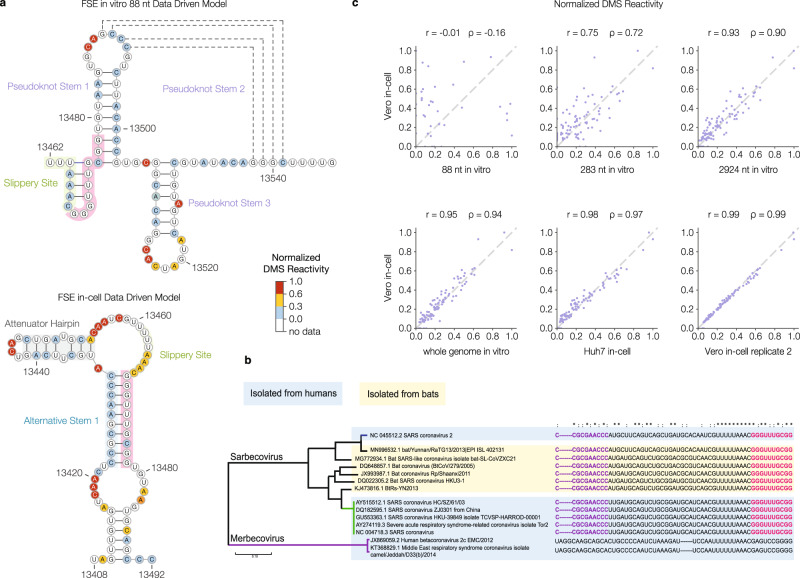
Fig. 4. The frameshifting stimulation element (FSE) adopts an unexpected structure in cells.
a Predicted structures of the FSE derived from DMS-MaPseq on in vitro-transcribed 88 nt RNA (top) and infected Vero cells (bottom). For the 88 nt RNA, reads were clustered into K = 3 clusters; in the cluster with the largest fraction of reads (60%), the given pseudoknot was among the three minimum-energy structures. Nucleotides are colored by normalized DMS reactivities (see Methods). The 5′ and 3′ sides of the alternative stem 1 (AS1) are highlighted in blue and pink, respectively (bottom), and the sequence that forms the 3′ side of AS1 is also highlighted in pink in the top structure. b Sequence conservation of FSE alternative stem 1 pairing. The 5′ and 3′ sequences of alternative stem 1 are highlighted in purple and pink, respectively. Symbols above the sequences indicate perfect conservation among all viruses in the alignment (*) or perfect conservation among only the sarbecoviruses (:). Source data are provided as a Source Data file. c Scatterplots of DMS reactivities over the FSE, comparing infected Vero cells and other contexts: 88 nt, 283 nt, or 2924 nt RNA fragments containing the FSE folded in vitro; whole genomic RNA extracted from virions and refolded in vitro; infected Huh7 cells; and a replicate of infected Vero cells. In each sample, DMS reactivities have been normalized by dividing by the maximum reactivity. For each comparison, the Pearson (r) and Spearman (ρ) correlation coefficients are given.

