Figure 6.
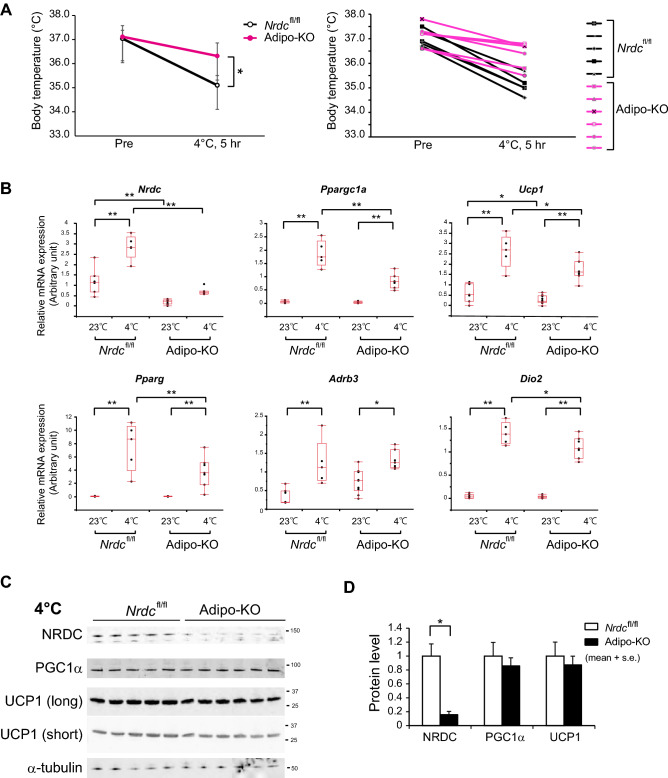
The cold induction of thermogenic genes is impaired in Adipo-KO mice. (A) Body temperature of 3-month-old Nrdcfl/fl and Adipo-KO mice before and after cold (4 °C) exposure for five hours. N = 5, Nrdcfl/fl (black line): n = 6, Adipo-KO mice (magenta line). Data represent the mean ± SD, *p = 0.0025 (right panel). Body temperature of individual mice before and after cold exposure. Nrdcfl/fl (black line), Adipo-KO mice (magenta line) (left panel). (B) Relative mRNA levels of thermogenic genes (Nrdc, Ppargc1a, Ucp1, Pparg, Adrb3, and Dio2) in Nrdcfl/fl and Adipo-KO BAT at 23 or 4 °C. Results were standardized with actb mRNA levels (in arbitrary units), shown in box and whisker plots, as described in Fig. 5C. N = 7, Nrdcfl/fl at 23 °C, n = 10, Adipo-KO at 23 °C, n = 5, Nrdcfl/fl at 4 °C, n = 7 Adipo-KO at 4 °C. Statistical analyses were initially performed by ANOVA followed by the Tukey HSD test. *p < 0.05, **p < 0.01. (C) Immunoblot analysis of total BAT extracts from Nrdcfl/fl and Adipo-KO mice after cold exposure with the indicated antibodies. N = 5, Nrdcfl/fl : n = 6, Adipo-KO mice, P90. (D) Densitometric quantification of signals in the immunoblot described in (D). Data are shown as the mean + SEM. *p < 0.05.

