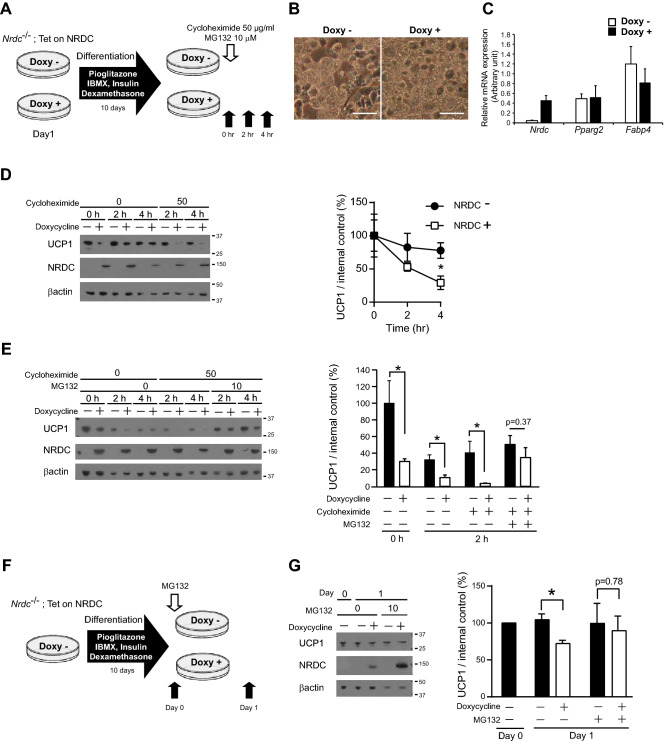
Figure 8.
NRDC promotes the protein degradation of UCP1. (A) Time schedule of doxycycline (Doxy)-induced NRDC expression in Nrdc−/−; Tet-on-NRDC cells, adipocytic differentiation, and the cycloheximide chase assay. Black arrows show the time points for sample collection after the treatment with cycloheximide and MG132. (B) Pictures of Nrdc−/−; Tet-on-NRDC cells after adipocytic differentiation with (right) or without (left) Doxy-induced NRDC expression. Scale bar, 100 µm. (C) Relative mRNA levels of Nrdc, Pparg2 and Fabp4 in Nrdc−/−; Tet-on-NRDC cells after adipocytic differentiation with or without Doxy-induced NRDC expression. Results were standardized with actb mRNA levels (in arbitrary units) and shown as the mean + SEM. N = 5. (D) Representative immunoblot image of the cycloheximide chase assay (Left panel). Signals in the immunoblot are quantified by densitometry and shown as a percentage relative to the value at time point 0 (Right panel). Data are shown as the mean (%) ± SEM of 4 independent experiments, *p < 0.05. (E) Representative immunoblot image of the cycloheximide chase assay with or without the MG132 treatment (described in A; Left panel). Signals in the immunoblot are quantified by densitometry and shown as a percentage relative to the value at timepoint 0 (Right panel). Data are shown as the mean (%) ± SEM of 4 independent experiments, *p < 0.05. (F) Time schedule of the adipocytic differentiation of Nrdc−/−; Tet-on-NRDC cells and Doxy-induced NRDC expression with or without the MG132 treatment. Black arrows show the time points of sample collection. (G) Representative immunoblot image of the analysis described in (F) (Left panel). Signals in the immunoblot are quantified by densitometry and shown as a percentage relative to the value on Day 0 (Right panel). Data are shown as the mean (%) ± SEM of 3 independent experiments, *p < 0.05.

