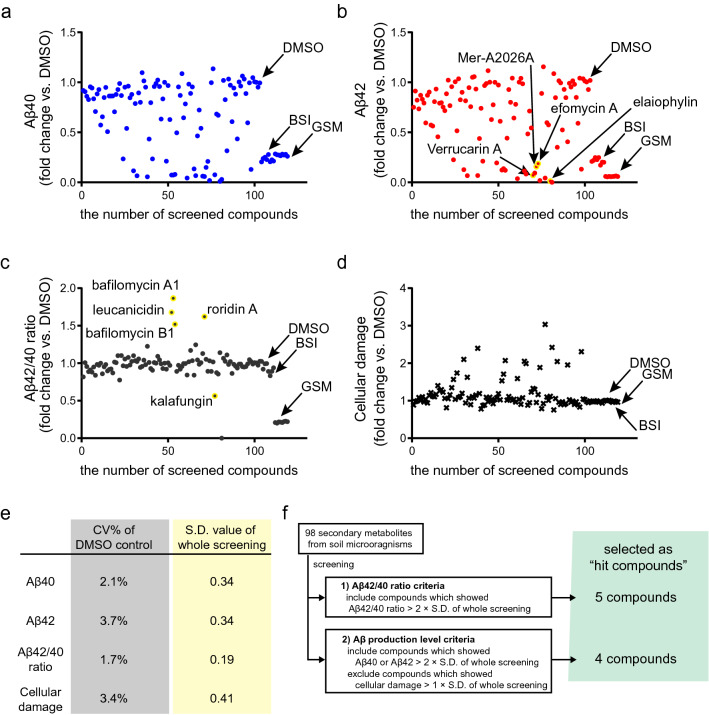
Figure 2.
Primary screen results by using cortical neurons of sporadic Alzheimer’s disease. Scatter plot graph of (a) Aβ40 (blue round), (b) Aβ42 (red round), (c) Aβ42/40 ratio (black round), and (d) cellular damage (black x-mark). Fold change compared with DMSO control was plotted after adding compounds at a concentration of 1 μM. Hit compounds were highlighted by yellow color with compound name. DMSO dimethyl sulfoxide (negative control), BSI β-secretase inhibitor (β-secretase inhibitor IV, positive control for Aβ40), GSM γ-secretase modulator (JNJ-40418677, positive control for Aβ42 and Aβ42/40 ratio). (e) Table showing coefficients of variation (CV%) of DMSO, negative control (left column), and standard deviation (S.D.) of whole screening for each analyte. (f) Hit selection criteria.

