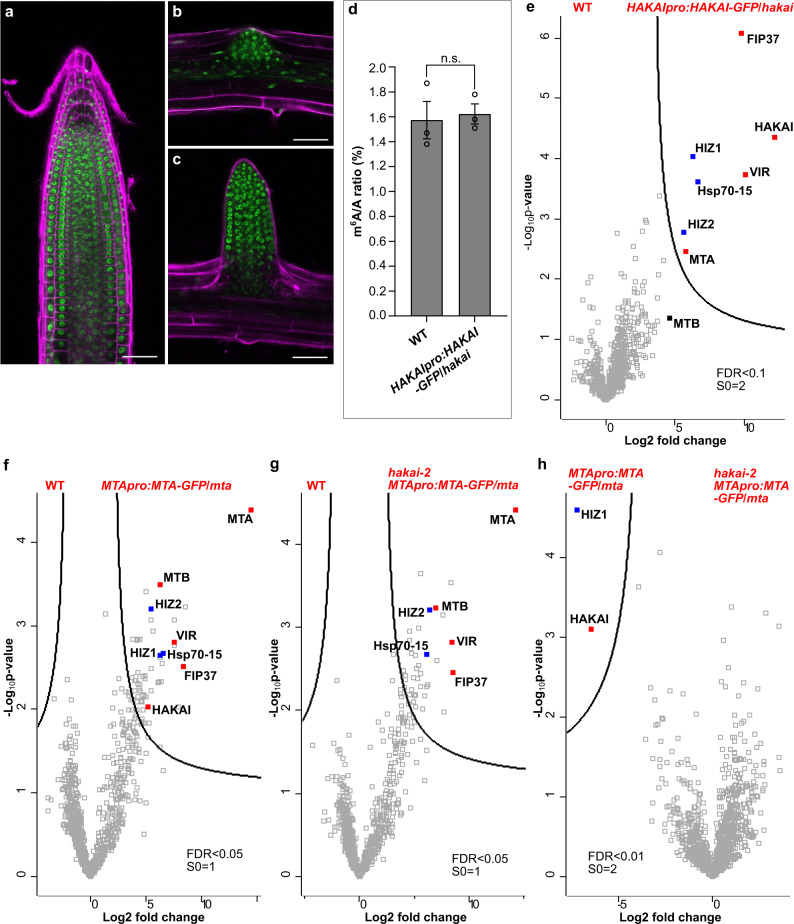
Fig. 1. Characterization of the HAKAIpro:HAKAI-GFP/hakai line and in vivo analysis of proteins interacting with HAKAI or MTA using GFP-tagged baits.
a–c The localization of GFP-tagged HAKAI in roots of 5-day-old HAKAIpro:HAKAI-GFP/hakai. a A primary root tip. b A lateral root initiation site. c A formed lateral root. Scale bar = 50 μm. Experiments in a–c were repeated independently at least three times, and representative images are shown. d m6A levels checked by two-dimensional thin layer chromatography (TLC) analysis. Data represent mean ± SE from three biological replicates and statistically significant differences relative to WT were analyzed by two-sided unpaired t-test (n.s. no significance). p = 0.7845. e–h Volcano plots showing proteins co-purified with HAKAI or MTA. The distribution of quantified proteins was plotted according to the Log2 fold change of label free quantification (LFQ) intensities and −Log10p-value obtained from two-sided student t-test of three independent experiments. Significantly enriched proteins were separated from others by a hyperbolic curve. Proteins indicated with filled squares represent known m6A writer complex members (red) and additional components identified in this work (blue). e HAKAIpro:HAKAI-GFP/hakai versus WT. HIZ1 and HIZ2 refer to HAKAI-interacting zinc finger protein 1 and 2 (AT1G32360 and AT5G53440, respectively). MTB is indicated not directly interacting with HAKAI, labeled with a black filled square. f MTApro:MTA-GFP/mta versus WT. g hakai-2 MTApro:MTA-GFP/mta versus WT. h hakai-2 MTApro:MTA-GFP/mta versus MTApro:MTA-GFP/mta. Source data are provided as a Source Data file.

