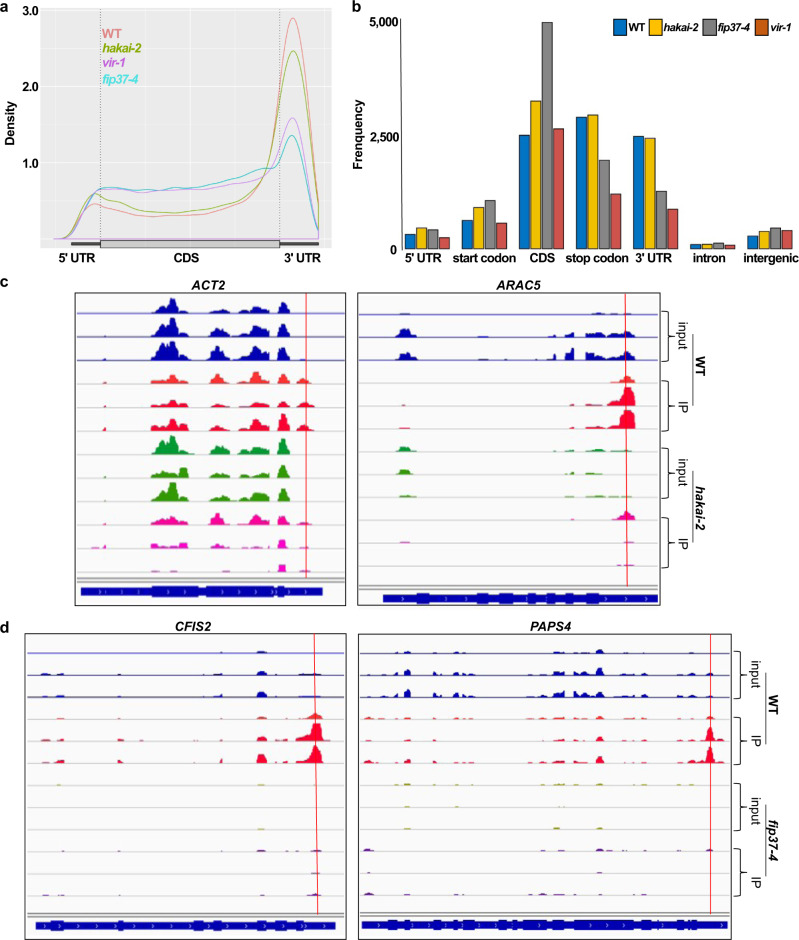
Fig. 5. MeRIP-Seq analysis of three key components of the m6A writer complex mutants.
a Metagene profile of the global distribution of m6A in WT, hakai-2, fip37-4 and vir-1. b Frequency of m6A sites in the different transcript parts in relation to their genomic position. c m6A topology differences between hakai-2 and WT in two key transcripts involved in root hair development (images from Integrative Genomics Viewer [IGV]). IP: immunoprecipitation. y axis scale for ACT2: 0–4000 reads; y axis scale for ARAC5 inputs: 0–1000 reads and for IPs: 0–4000 reads. Red lines here and in d represent the positions of predicted m6A peaks. d m6A topology differences between fip37-4 and WT in two examples of the GOBP mRNA polyadenylation group (images from IGV). y axis scale for both CFIS2 and PAPS4: 0–1000 reads.

