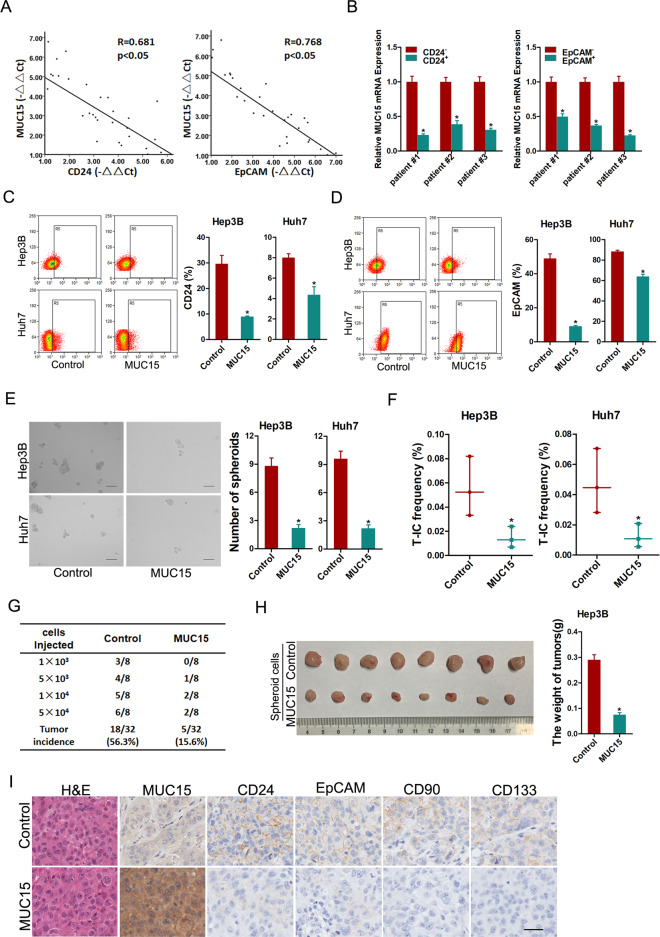
Fig. 2. MUC15 inhibits liver T-ICs expansion.
A The correlation between the level of MUC15 and CD24 (left) or EpCAM (right) in primary HCC cells (n = 30) was determined by real-time PCR analysis. B Real-time PCR analysis MUC15 expression in sorted CD24+ (left) or EpCAM+ (right) primary HCC cells relative to negative cells. C, D Flow cytometry analysis of CD24+ or EpCAM+ populations in spheroids generated from MUC15 overexpression hepatoma cells and control cells. E Representative images of hepatoma spheroids generated from MUC15 overexpression hepatoma cells and control cells. The number of spheroids was counted and compared. F The frequency of liver T-ICs in MUC15 overexpression hepatoma cells and control cells was compared by in vitro limiting dilution assay. G Hepatoma cells dissociated from Hep3B MUC15 spheroids or control spheroids were inoculated into NOD-SCID mice subcutaneously, and the tumorigenicity was evaluated two months post inoculation. H In total, 2 × 10⁶ cells dissociated from Hep3B-MUC15 or Hep3B-control spheroids were subcutaneously inoculated into NOD-SCID mice (n = 8) and excised 7 weeks later. The weight of xenografed tumors from different groups was compared. I Representative images of immunohistochemical staining of liver T-IC markers in xenografted tumors. Scale bar = 25 μm. All results are presented as the mean ± SD, and statistical significance was assessed using a two-tailed Student t-test. *p < 0.05.

