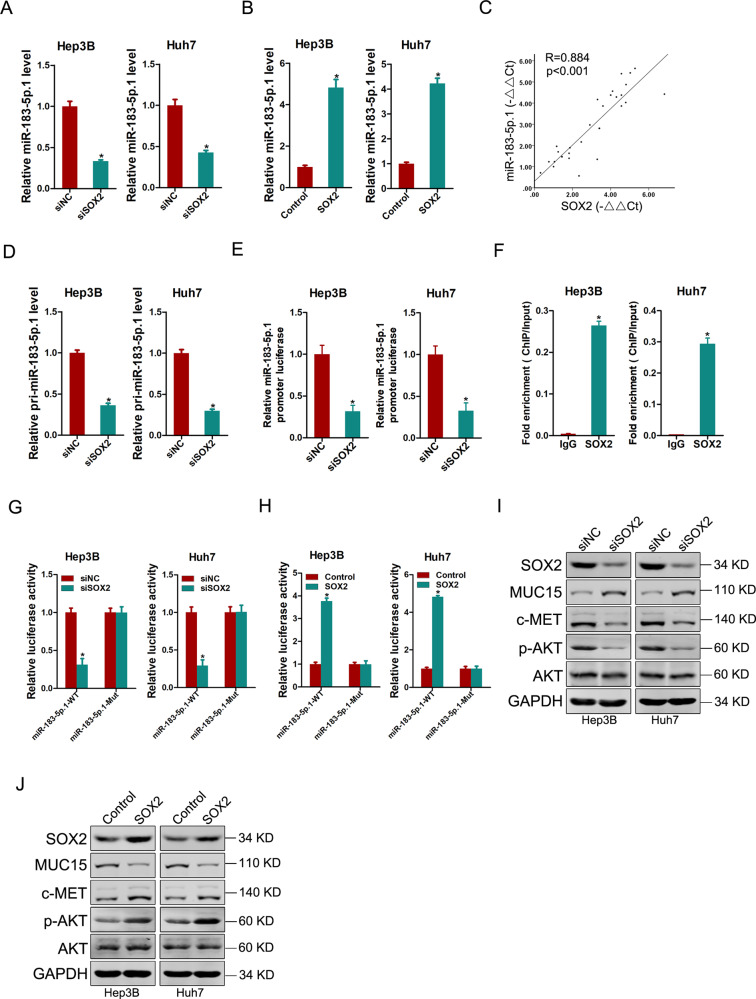
Fig. 6. SOX2 upregulates miR-183-5p.1 in liver T-ICs.
A Real-time PCR analysis of miR-183-5p.1 in spheroids generated from SOX2 knockdown hepatoma cells and control cells. B Real-time PCR analysis of miR-183-5p.1 in spheroids generated from SOX2 overexpression hepatoma cells and control cells. C The correlation between the level of SOX2 and miR-183-5p.1 in primary HCC cells (n = 30) was determined by real-time PCR analysis. D Real-time PCR analysis of pri-miR-183-5p.1 in spheroids generated from SOX2 knockdown hepatoma cells and control cells. E The luciferase reporter activity of miR-183-5p.1 promoter was measured in SOX2 knockdown and control HCC spheres. F Hepatoma cells subjected to ChIP assay with anti-SOX2 or anti-IgG antibody. G The luciferase reporter activity of miR-183-5p.1-WT or miR-183-5p.1-Mut promoter was measured in SOX2 knockdown and control HCC spheres, and the relative activity was presented (relative to control). H The luciferase reporter activity of miR-183-5p.1-WT or miR-183-5p.1-Mut promoter was measured in SOX2 overexpression and control HCC spheres, and the relative activity was presented (relative to control). I Western blot analysis of indicated proteins in spheroids generated from SOX2 overexpression hepatoma cells and control cells. J Western blot analysis of indicated proteins in spheroids generated from SOX2 knockdown hepatoma cells and control cells. All results are presented as the mean ± SD, and statistical significance was assessed using a two-tailed Student t-test. *p < 0.05.

