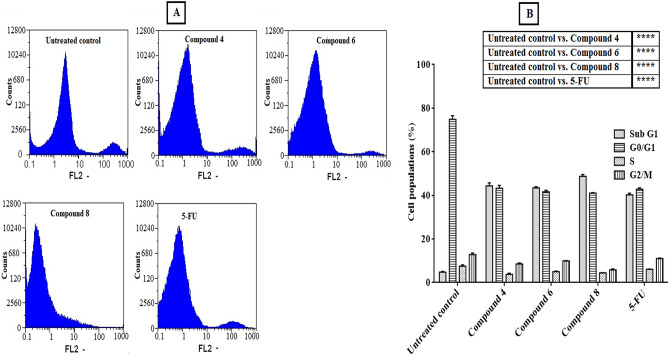
Figure 4.
Cell cycle distribution analysis of Caco-2 cells treated with potent antitumor synthesized compounds compared to 5 FU standard anticancer drug for 48 h, (A) original flow charts of cell cycle diagrams, and (B) quantitative distribution of the treated cells in cell cycle phases compared with control (untreated) cells. Each bar represents the mean ± SEM (n = 3) and *p < 0.05, **p < 0.01, ***p < 0.001 and ****p < 0.0001 versus untreated control.

