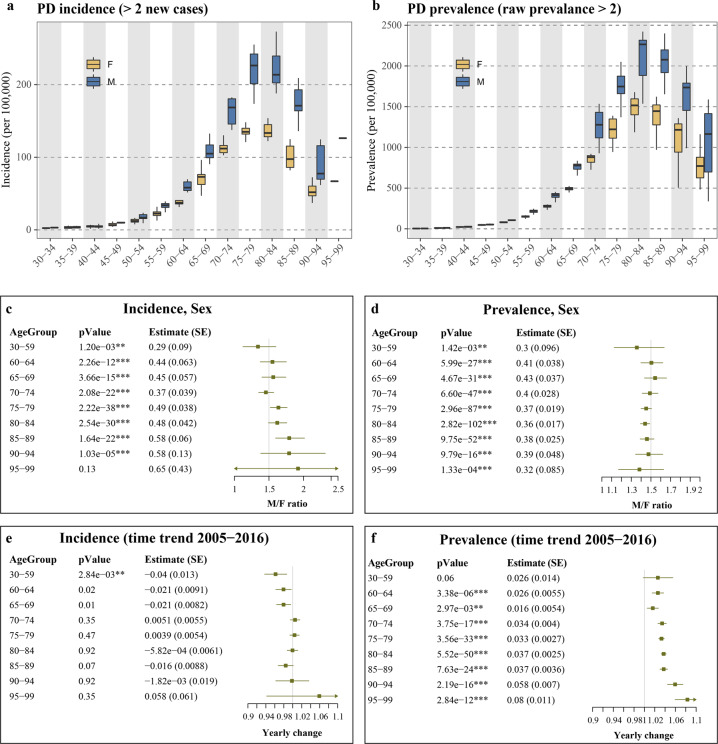
Fig. 1. Incidence and prevalence of PD in the Norwegian population during 2005–2016.
a, b Incidence and prevalence were first calculated for each observation year by dividing the number of new or total PD cases by the corresponding age- and sex-matched population size in the same year. For presentation purposes, the measures were summarized by age groups. Data points for which the number of new cases/raw prevalence were <2, were excluded. X-axis indicates the age group of the individuals. c–f The impact of sex (c, d) and time (e, f) were assessed individually for each age group, using Poisson regression. The p-values and the estimates for each covariate are shown in tables (for time trend, the estimate represents the natural log of the estimated change in each sequential year). SE, standard error. M/F ratio and Yearly change were derived by taking the exponential of the estimate for each covariate (sex or year). Lines represent the 95% confidence interval.

