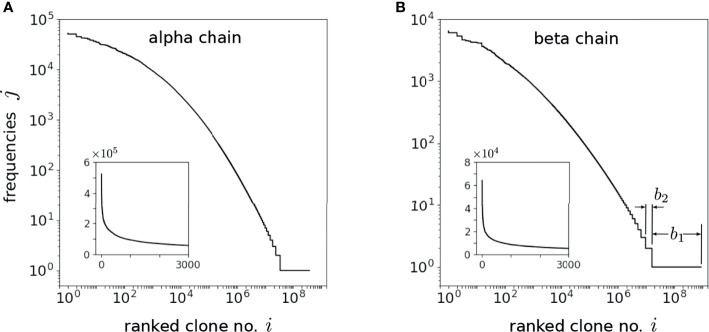
Figure 5.
Ordered integer-valued frequencies j, plotted on a log-log scale, of the C* distinct (A) alpha and (B) beta chains drawn using OLGA. The index 1 ≤ i ≤ C* < N* labels the distinct sequences drawn while bj is defined as the number these sequences that exhibit the specific frequency j [b 1 and b 2 are explicitly indicated in (B)]. The highest frequency clone appears J times such that bj>J = 0. Since C* is comparable to N* , the drawn sequences are dominated by the low probability ones that appear only once. The insets display the frequencies on a linear scale and indicate the long-tailed behavior of the frequencies. The shape of the frequency spectra is self-similar once N* ≳ 107, allowing us to use this sampling procedure to reliably estimate .

