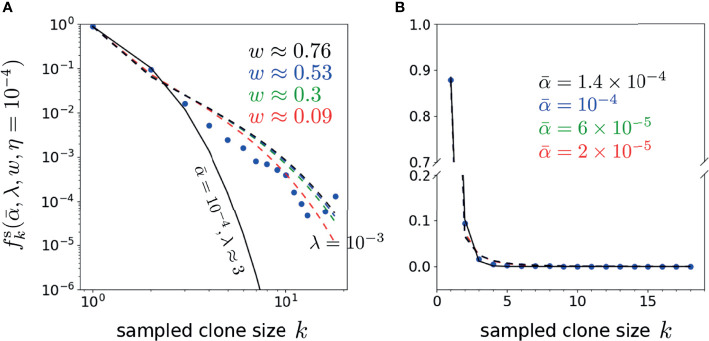
Figure 9.
Plots of the representative optimal solutions of clone counts from Eq. 19 (using η = 10-4 and λ = 10-3 unless otherwise indicated) plotted along side the shown data from Oakes et al. (12). The model predictions and CD4 beta chain data are shown in both (A) log-log and (B) linear scales (there are no zero-values clone counts in this dataset). In (A), the best fit model for the neutral model (w = 0 and ) using is given by λ ≈ 3 shown by the solid black curve. The dashed curves represents best-fit curves using the values associated with the error minima in, where , w ≈ 0.09 (red), 6 × 10⁻⁵, w ≈ 0.3 (green), 10-4, w ≈ 0.53 (blue) and 1.4 × 10⁻⁴, w ≈ 0.76 (black). Note that the neutral model fits well for only the first 2-3 k-points, while the heterogeneous model (w > 0) fits better at larger k.

