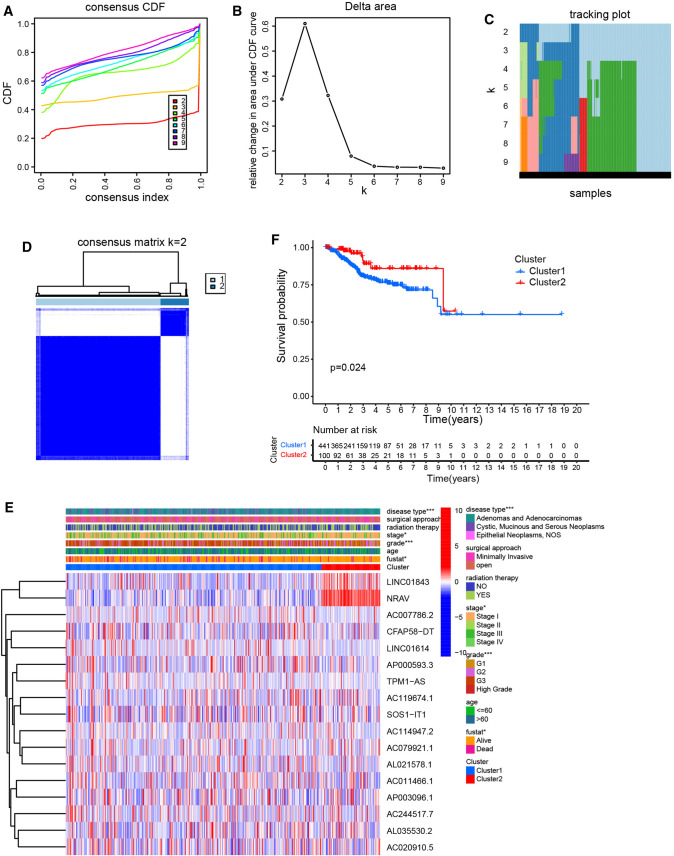
Fig. 3.
Classification of EC based on hypoxia-related lncRNA. (a) The cumulative distribution function (CDF) plots show the cumulative distributive functions of the consensus matrix for k values (indicated by different colors) between 2 and 9. b, c Relative change in area under CDF curve (b) and tracking plot (c) according to various k values. (d) The heatmaps show the consensus clustering matrix for hypoxia-related lncRNA in the EC dataset for k = 2. e Heatmap shows the association of clinic pathological features based on the two clusters. f The survival analysis of EC patients between cluster 1 and 2 in TCGA cohort

