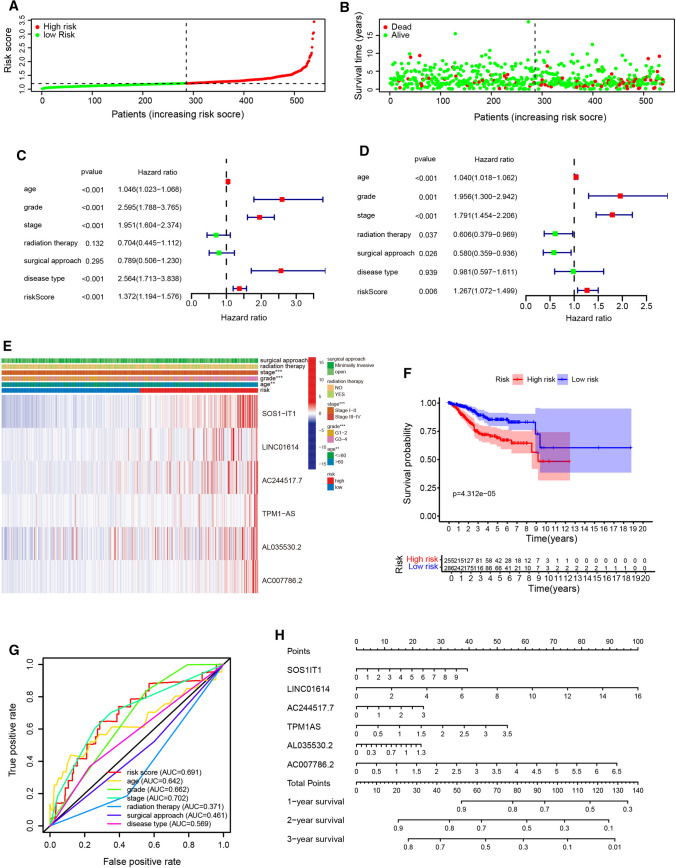
Fig. 4.
Prognostic value of hypoxia-related lncRNA and construction of a risk signature predicting prognosis. a The risk scores for all EC patients in entire cohort are plotted in ascending order, and marked as high-risk (red) and low-risk (blue), as divided by the threshold. b Survival days of EC patients were showed in ascending order of risk parameters. c, d The forest plot of univariate (c) and multivariate (d) Cox regression analysis in the cohorts. e Heatmap shows the association of risk scores and clinic pathological features based on the six lncRNA risk signature. f The Kaplan–Meier curves of OS in the high-risk and the low-risk groups stratified by the hypoxia-related lncRNA signature in the cohorts. g The ROC analysis of OS for the signature and the clinicopathologic parameters. h The nomogram for predicting proportion of patients with 1-, 3‐ or 5‐year OS

